When the Market Turns ‘All-or-Nothing’
You can always tell when there’s a lot of fear amongst investors in the market, because nothing works.
Tuesday of last week was a good example; prices fell, assumptions tanked, chatter darkened, fear rose and then the algorithm traders flushed out ETF sales, which drags down everything.
And the media, well, they just made up stories to fit the drama, depending on which channel you tuned into.
I suspect we’ll have a few more days like Tuesday between now and the election.
A Small Nugget to Remember
In my humble opinion, we will rue the day we ever bought into the ETF idea, produced as yet another so-called benefit to help us manage risk or to allegedly reduce costs.
The success of the marketing gimmicks used to produce this interest is nothing short of amazing. And I fear how enchanted people have become with these things while so many understand so little about what they are actually causing to happen in the marketplace.
You sell a block of any ETF, or get a crowd reaction to do so, and they are simultaneously selling an equal amount of every stock in that ETF.
For long-term investors it has in many cases produced a more volatile marketplace, driving an even more intense focus on the long-term to overlook these maladies.
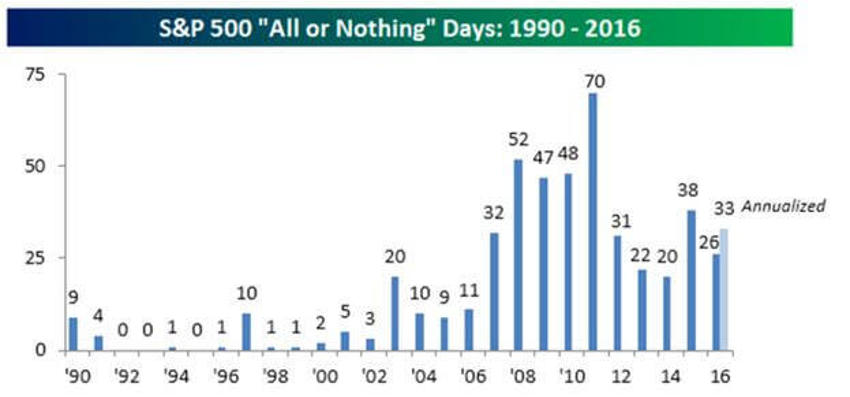
Here is a snapshot for you to track the rise in the number of days like this:

What's an All or Nothing Day?
An all-or-nothing day is a trading day where the net advance/decline (A/D) reading for the S&P 500 is greater than +400 or less than -400.
On Wednesday of last week the net advance/decline (A/D) reading on the S&P 500 registered -457, marking the sixth all-or-nothing day for the S&P 500 since Labour Day (Monday, 5th September).
At this rate, 2016 will likely come up short of the 38 occurrences in 2015.
However, this would still place it as the sixth most number of occurrences for a given year since 1990.
Note the history in the chart. Only one thing changed over that period; HFT teams, robot equations and ETFs have gained in popularity.
Because ETFs allow an investor to move an entire basket of stocks in one trade, the market has become increasingly one-sided in terms of its daily moves.
As I’ve noted before, on big ‘up days’ nearly everything rallies (ALL), while on days like Tuesday, nearly everything declines (NOTHING).
In a word it's called: Laziness.
It also makes it simple to trigger massive waves of impatience; a sure killer of all investment plans.
Reality Check?
The kick-off to earnings season landed like a thud in the shape of AA's "miss." In the middle of a split of the companies, I’m pretty sure this was as messy a quarter as you could imagine.
Last week we covered the idea that analysts routinely crank down estimates in the weeks before earnings season begins. My hunch has always been that 2008-09 caused all analysts to think first of job security. Now the "I will never over-estimate the upside again..." mentality comes across sounding more like "I am being prudent."
Then companies spend the next 8 weeks announcing earnings that for the most part, can often exceed expectations.
Let's take another perspective of this now that the season has begun to trickle in:

Upside Surprise
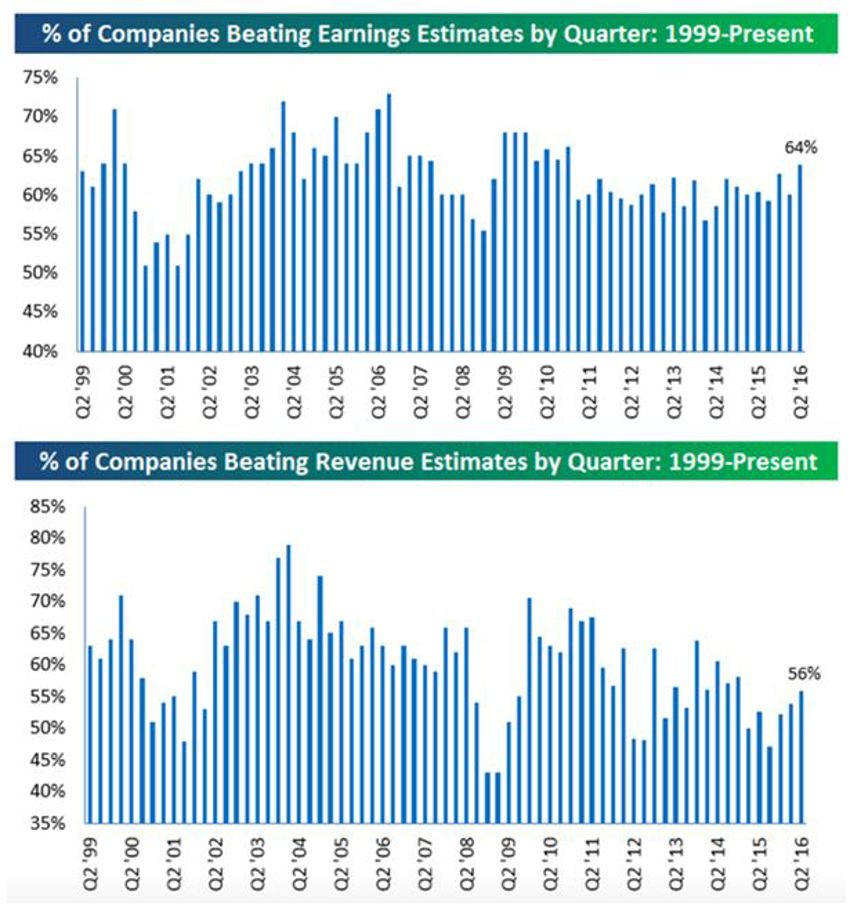
The chart set above provides a look at the historical "beat rates" for bottom-line EPS and top-line revenues for every quarterly earnings season going back to 1999.
It covers some good and not so good times in the calendar.
Over those 17 years, the average quarterly earnings beat rate (% of companies beating their consensus analyst EPS estimate) has been 62%.
The average revenue beat rate has been slightly lower at 60%.
Upon observation, we can see earnings beat rates were higher during the bull market of the mid-2000s, with a lower bar having been set over the last five years.
But, last quarter we saw the highest earnings beat rate since Q4 2010, clocking in at a rather large 64%.
On the revenue beat side, note those rates have steadily trended lower over the years, but we have seen a quarter-over-quarter increase in top-line beat rates over the last three earnings seasons.
My two cents worth on this is to blame the volatility of the energy sector hiccup.
The revenue beat rate last quarter was 56%. Something close to that this time will help secure solid footing for a turn in overall earnings going forward.
Small Business and Washington DC
Many think it is the Fortune 500 companies which drive the bulk of jobs growth. It’s easy to get that sense given how the media feeds out data.
However, that assumption is incorrect.
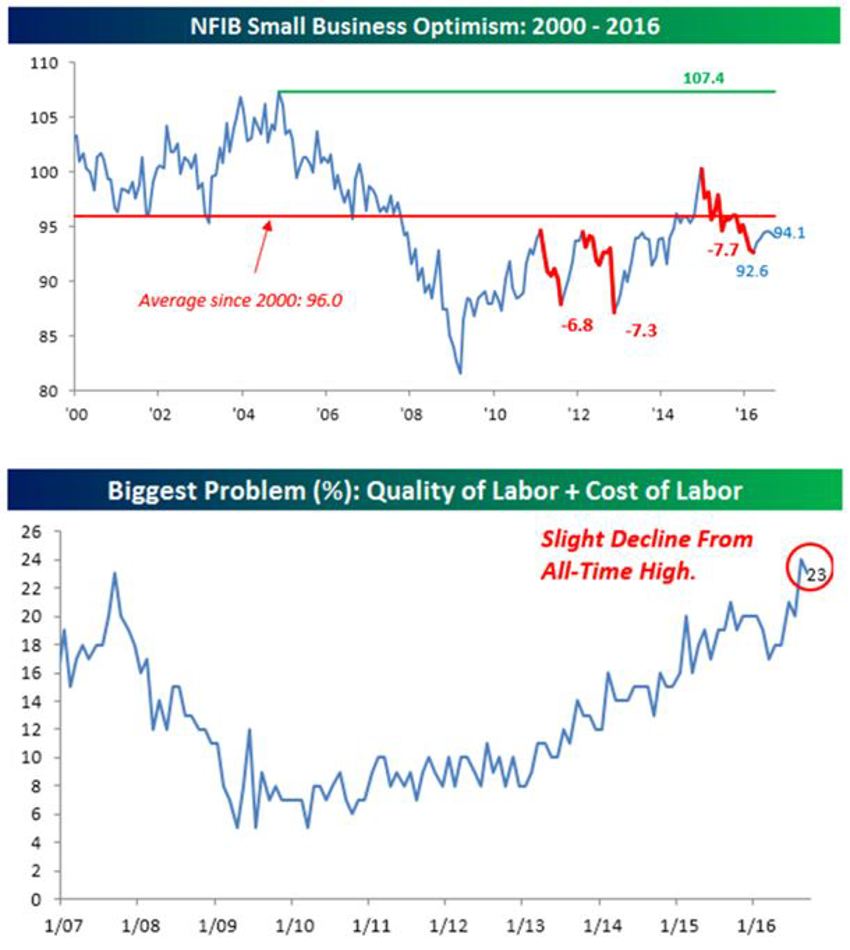
It’s small business that is the major driver of expansion and jobs growth. As such, the snapshots below provide important insights on that segment of the market’s ‘feelings’ which further supports America’s fiscal policy needs for growth.
Let's Review

Fiscal policy is choking what would normally be seen as a more solid set of economic numbers.
Yes, some will argue that slow growth is good at times and can keep things steady for longer.
I just make these points so that we do not get lulled into the very flawed view that America’s economy is somehow broken.
It’s not.
It’s merely climbing up a mountain - the same mountain we always climb together - with the equivalent of a 5,000 pound sack around its neck.
The chart set above shows this in vivid colour. While a series of economic data reports showed a nice rebound in September from the summer lull, the latest release of small business sentiment from the NFIB showed the opposite: further weakness.
At 94.1 it fell modestly from 94.4. With this month's decline, the headline reading is not only still well below its average of 96.0 since 2000, but also just 1.5 above its recent low of 92.6.
The blame is likely a nasty political brew. Small business owners were not optimistic.
This comes straight from the report:
"The presidential election is so divisive that it offers little promise of a bipartisan effort to deal with any of these important issues once a new management team is installed in Washington D.C. Fiscal policy, badly in need of an overhaul, will face similar challenges. The political impasse leaves owners with the prospect of slow growth, more uncertainty and little capital spending beyond 'maintenance'."
More specifically, the second chart above gives you a different insight: Right behind tax and regulatory increases (remember this is small business, not some Wall Street bank), the largest pressure is coming from quality and cost of labour.
The chart also shows us the combined percentage of small business owners citing Quality or Costs related to labour as their number one problem each month. It fell a tick to 23% this month from last month's reading of 24% (a ten year high!).
That is not the type of record we want to be known for. It stifles growth.
And when you see this type of data, you should think that we’re not seeing as much growth as we could. We are all working hard and producing more but the raking off the top from those efforts is showing little in the "net growth" column.
Remember, it’s not the economy; it’s the extra weight placed on it and being carried as costs.
Simplify: Take the chains from the economy's neck and powerful surprises to the upside for all concerned will be the most likely outcome.
Beyond the Near-Term Hurdles
The good news about the near-term bad news is that without things to fix, to make better or create efficiencies to resolve, we would have no future.
It’s this constant tension of what needs to be fixed next that drives our entire economy forward. So let's pray for more problems to solve.
The market bumps and bruises will all heal in time, and we have a freight train of demand coming our way in the model of our demographic powers.
This very lengthy and sloppy trade range that we’ve been tied down by is slowly but surely setting the stage as a new foundation from which it can expand.
And yes, I know that does not mix with what you’re hearing on the news, but the news has never made anyone any money.
Proper Perspective
On November 11, 2015, about 11 months ago, the SPY stood at 211.66.
Since that time is has changed about +1.04%.
That’s frustrating.
But you have to stay focused. And don’t expect much while we move through the last month of this election show – and it could get even uglier.
A vast majority of the wealth manager audience has done a woeful job this year on results.
I have a hunch thy will work hard for a solid finish. And an avalanche of money remains perched in back accounts and bonds.
The Latest on Bullish Market Views

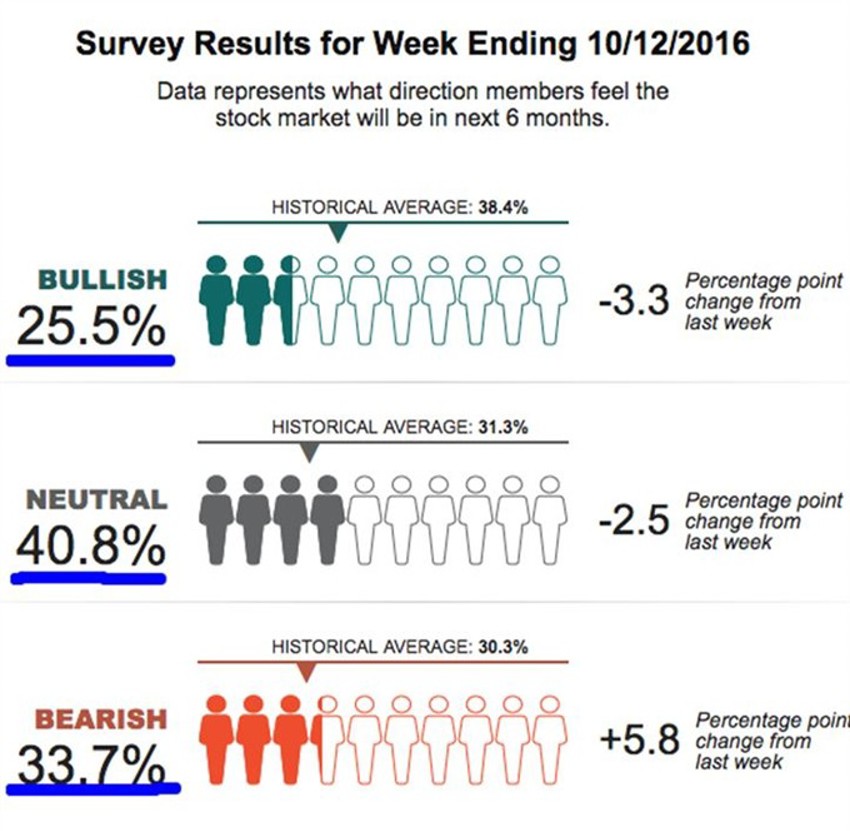
Note the coloured figures in the bullish column above on the latest AAII chart.
Take that one-half shaded figure away from this chart and you have the same bullish rankings you had at the 2009 and 2003 lows, both of which were some 12,000 Dow Jones points ago.
In Closing
We have suggested for weeks that the odds were there for weaker activity as the crowd becomes more polarized around the election process.
Add in the normal earnings season feeling of walking on egg shells and you get sloppy market activity and a growing pit in your gut.
Long-term investors should focus on what’s beyond this latest bout of altitude sickness; be patient and stay focused and on your plan.
Think demographics, not economics.
We are in great shape with a solid future ahead but as always plenty of potholes to work around.
