When It’s Neither Boom Nor Bust
The markets have been sloppier this week than most of the averages would indicate.
The odds are that many investors are beginning to smell the scent of growth. Yes, that sounds odd but the sector influences are pretty clear.
Dividend focal points are feeling the brunt as fears about rate increases remain front and centre, just as expected. Long-term dividend growth income seekers see this often over history. Bouts of profit-taking are normal as the cloud of interest risk is being overdone as usual.
As soon as the media tires of scaring their viewers to death about the election fallout, we can be sure they will fill that void with "The Countdown the December US Fed Meeting Interest Rate Hike" complete with lots of video, and experts helping you to see the end of the world as we know it.
Good Things Come in Slow Packages?
Today, as the economic power baton is being passed from one record-size generation to the next – the Baby Boomers to the Millennials of Generation Y – it’s easy to feel like we’re walking in quicksand.
And it’s even easier to envision how far down the market can travel if the world comes to a stop again. The higher prices rise the worse that feeling in your gut may get, if you’re focusing on the wrong data.
The reality is that it’s neither a boom nor a bust in the US.
What's interesting about that statement is how the constant complaint of slow growth blinds the investor herd entirely to the idea that this may be a good thing.
You can be absolutely assured that if we were instead having a robust boom, you wouldn’t be hearing about the boom for all the noise about the potential for a bust.
The media would focus on inflation concerns, over-heating concerns, global imbalance concerns, social fairness concerns and rate increase concerns.
And therein lies the problem: There is no good news. Get used to it. But don't overlook how a slower, steadier growth process can last much longer than most are prepared for, and potentially longer than the boom and bust cycle we have experienced in the past.
In an economy that is being reshaped at high speed, it could be a grave mistake to assume old economy readings and reports are providing a true and fair picture of what is really unfolding.
Stagnation?
Not really...even though it understandably feels that way.
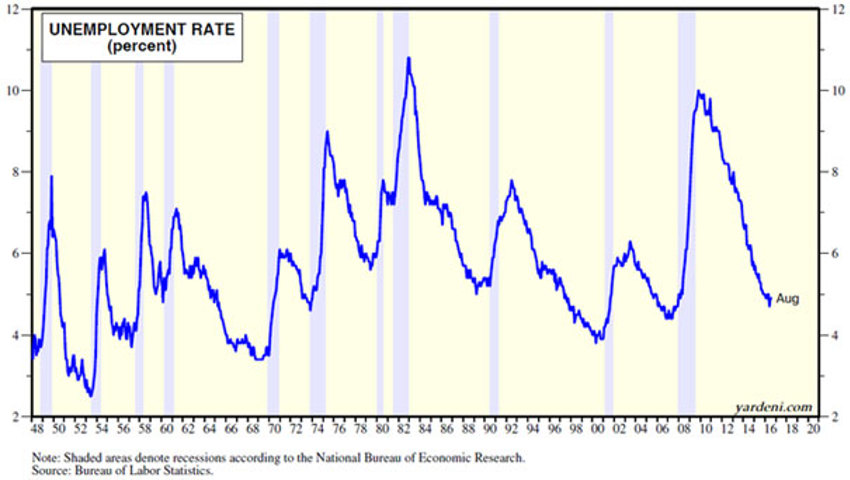
While the descriptive term “secular stagnation” fits the global economy, I don’t think it’s valid for the US where the unemployment rate is now down to 4.9%
Let’s review the other data that suggests the world may indeed be turning in many places.
- Metals prices are stabilizing and in some cases rising.
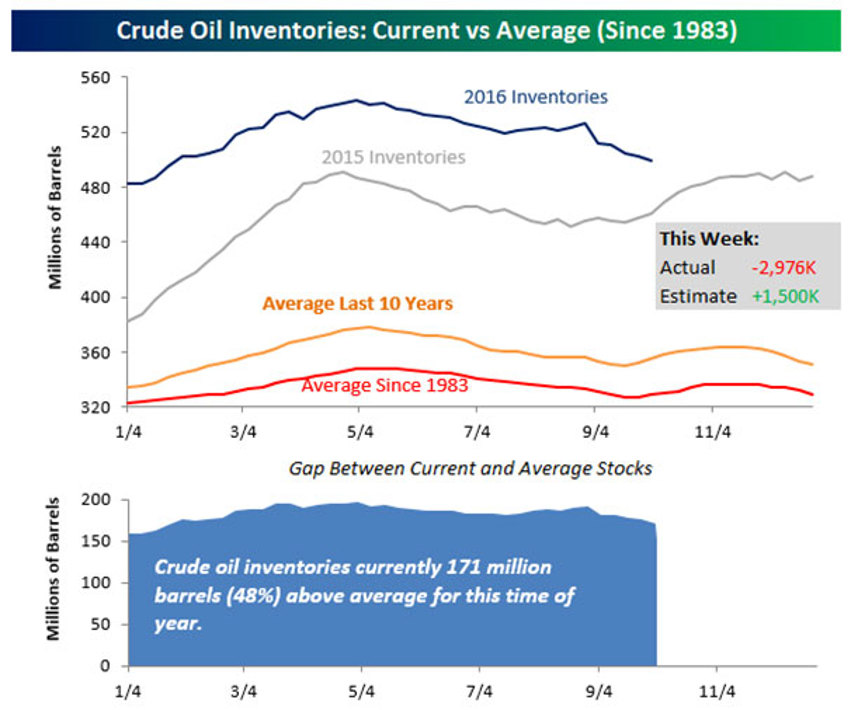
- Crude inventories are falling as production is halted until prices balance out better.
- Yes, car sales are stalled, but they remain near record highs and on a 17.5 million pace for the year.
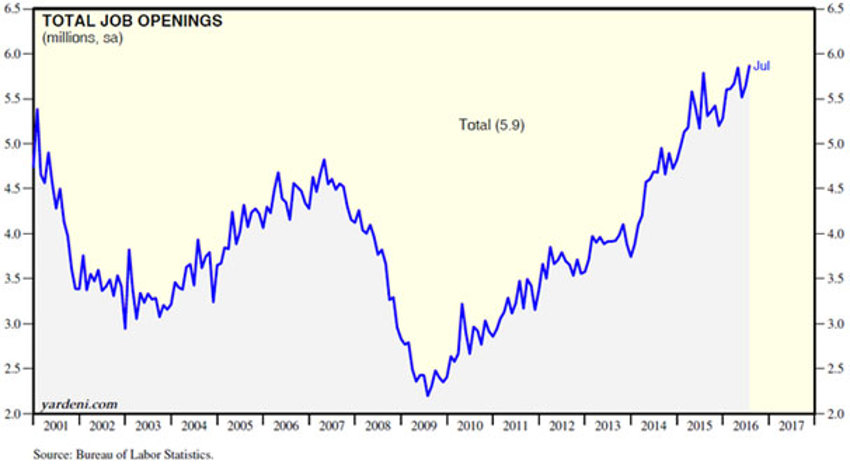
- Job openings are at a record high.
- Private-sector employment gains have exceeded 150,000 per month for 40 of the last 41 months.
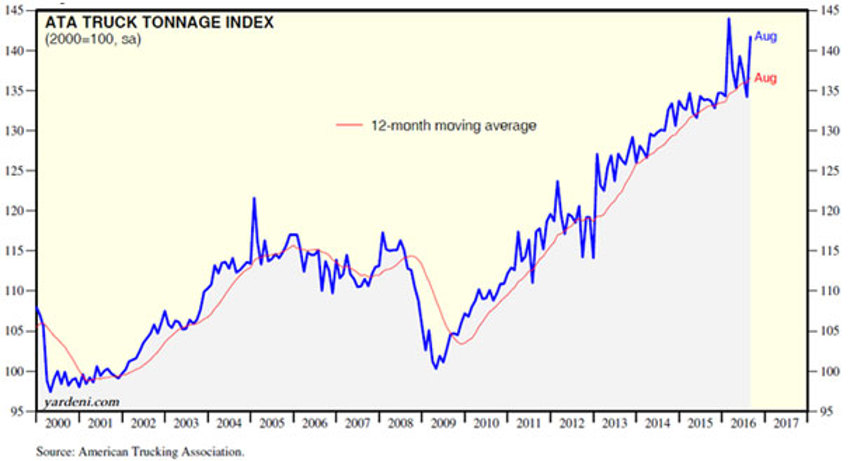
- ATA's Truck Tonnage Index rebounded smartly during August almost back to February’s record high.
- Medium-weight and heavy truck sales rebounded in September following several months of decline. This likely another signal related to the energy sector’s recession slowly nearing an end as referenced in many previous notes.
- Even though the Eurozone is suffering through its own pain related to Brexit fears, retail sales are strong - up 1.7% year-on-year during August, based on the three-month average, to a new record high.
- The rebound is widespread in the region. August passenger auto registrations, on a 12-month basis, rose to the highest pace since fall 2010.
- Another small surprise - even China has some good data with railway freight traffic rising 1.0% year-on-year during August. That is the first positive comparison in 32 months!
- Sure, China’s PPI was down again in August - 0.8% year-on-year. However, that was the best reading since April 2012.
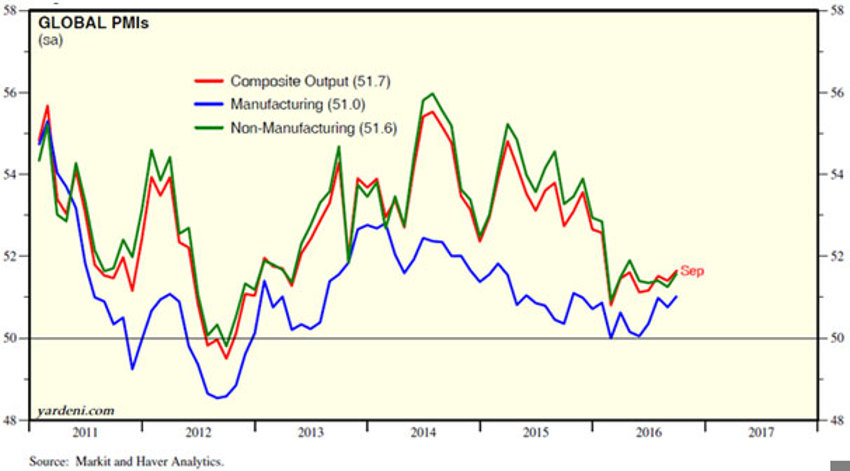
- Global PMI's are also turning up close to making new two-year highs. Note in the chart below that this downturn wave and bottoming process also mirrors the energy sector bust and restructure.
And just this week unemployment claims fell even further, coming within a sliver of the all-time lows. Dr Ed Yardeni has provided some great charts which show a somewhat consistent effort of growth turning for the better.
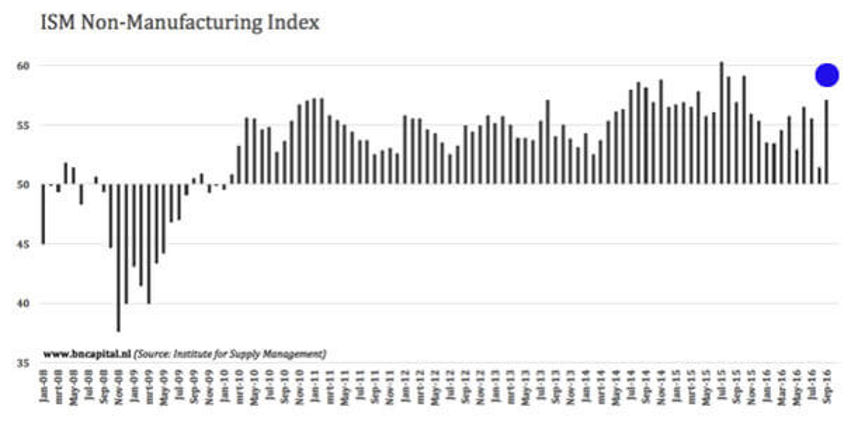
Cap this all off with the largest month-over-month increase on record for the ISM Non-Manufacturing Data released and you begin to get a feel for the stabilization effort being pretty widespread.
Take a quick view below:
Market Chop and Angst
Look, I can understand why the market is chopping a bit – we haven’t moved very much since the breakout bounce after "Branic."
See the SPY chart here:
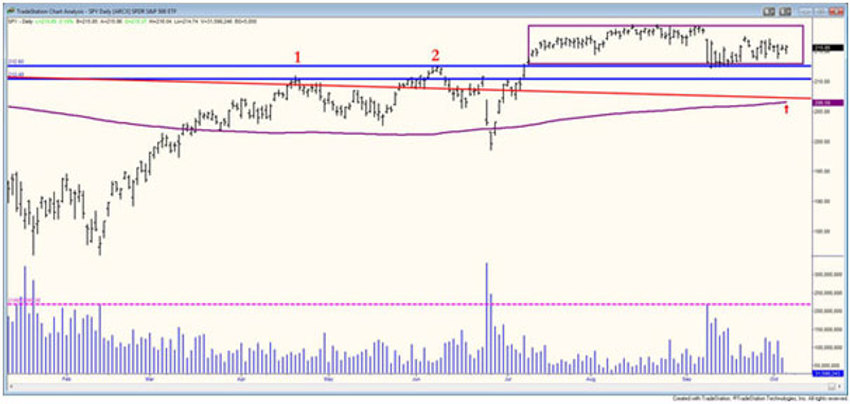
- Item noted at 1: The SPY has risen just 2.41% since April 20 of this year
- Item noted at 2: The SPY has risen just 1.58% since June 8 of this year
The purple box at the top-end of the chart covering all activity since we broke out shows we have travelled a very small distance indeed since that breakout, and we are effectively flat for the period.
Yep, walking in quicksand – the entire rate of change (from the dates noted above) is now a normal trade range in a single day!
What we must ensure we keep focusing on is the long-term. Churn is the name of the game for large periods in a perceived slow-growth cycle.
The more important takeaway is that you’re not missing anything; the market is on pause until we get the election out of the way and move past the Q3 earnings parade.
And by the way, waiting is fine. Don't swing at the pitches in the dirt in the interim just because the media keeps throwing them.
The Power Continues to Brew
The data above provides continuing support for the theme that now is a time of many waves of change.
The economy we are seeing unfold is set to change everything we think we know today.
The dynamic world of tomorrow is set to be as surprising as trying to explain what an iPhone is to someone back in 1982.
Required Disclaimers on all videos and content
