When “B-O-N-D” Becomes a Four-Letter Word
When will the dour levels of investor sentiment end?
Likely at much higher prices, and with far less than $9 Trillion sitting in deposit accounts as it is today.
It will be when "bond" has become a 4-letter expletive signifying foolishness and almost no one will remember anything bad about markets or equities.
In other words, it will be a long time from now.
Wilting Sentiment
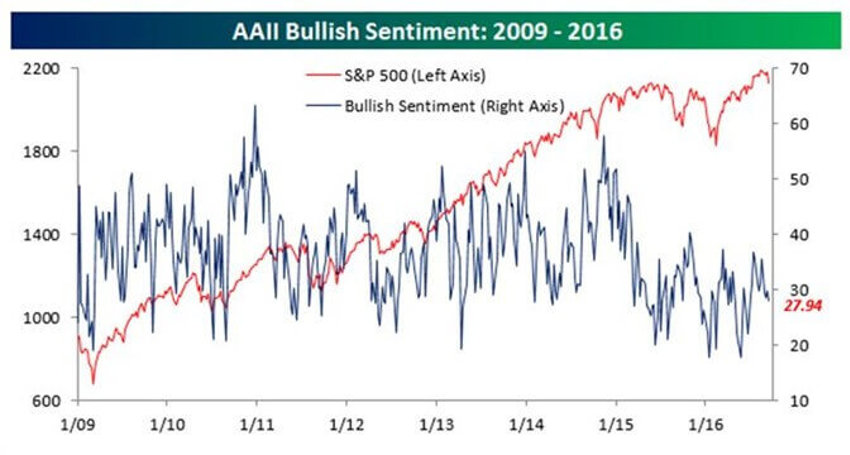
For those expecting otherwise, the sentiment snapshot below is pretty clear (and pretty ugly):

When the market goes down, bullish sentiment retreats and bearish sentiment spikes.
And when the market rises, bullish sentiment barely budges.
Last week bullish sentiment declined from 29.75% down to 27.94%, near again to the levels seen at the bottom of the pit in 2009! That was due to that 400 point drop last Friday.
The decline also sets another record as the 46th straight week, and the 80th time in the last 81 weeks, that bullish sentiment has been below 40%.
Said another way: About 72% of investors surveyed nationally don't like the stock market.
As for Bearishness?
While the bulls meandered about, the bears moved like a well-trained platoon; as selling cascaded into the market, bearishness went from 28.48% last week to 35.92% this week. That’s a seven point increase - the largest since mid-June; when Brexit put investors into full flight mode.
Fear continues to run deep, the market is playing a continuous game of musical chairs and investors keep wondering where they’ll be able to sit when the music stops.
Clearly the hauntings of 2000-2003 and 2008-2009 remain fresh and cause sentiment to shift rapidly at the first hint of trouble.
It’s hard work for short-term players and a boon for the longer-term investors, or at least it should be looked at this way.
Technically Speaking
I prepped a short little video review of the SPY charts from a technical perspective. Check it out.
The markets are essentially doing what they normally do; testing breakout regions and building price supports. This chop is actually health for the long-term structure that we want to see.
Improvements Anyone?
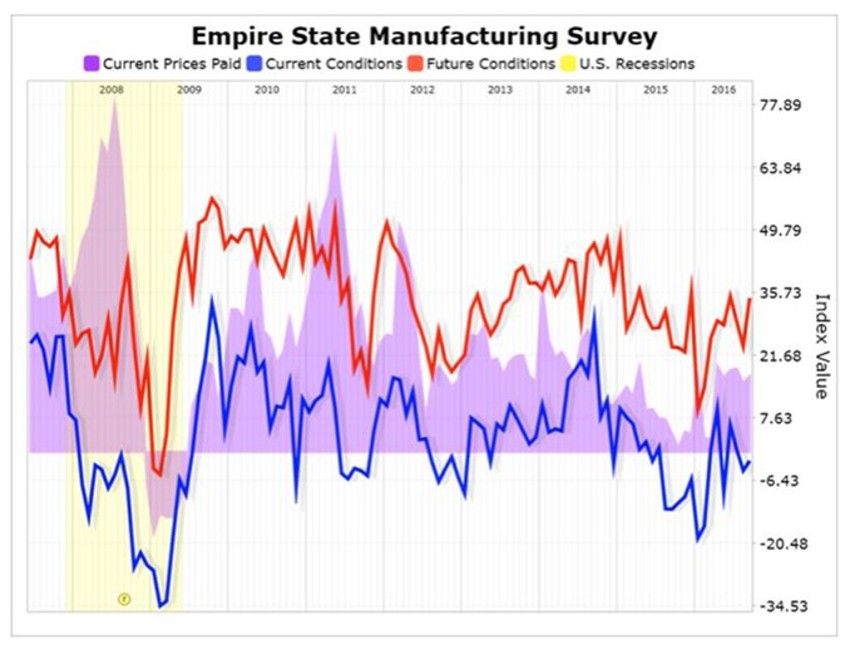
While headlines keep painting the market red, it seems the manufacturing data is once again improving.
And I suspect this matches up with data in recent weeks from other regions as well, which all show the pain felt in this sector (driven primarily by huge setbacks in energy-related orders output) is slowly abating.

And yes, I know that red ink makes it tough to look forward but that, folks, is where the money is made.
The Empire State Manufacturing Survey chart above is a series of diffusion indices distilled from a monthly survey of New York regional manufacturing executives, and seeks to identify trends across 22 different current and future manufacturing related activities.
The latest release showed a general improvement for both current and future assessments of manufacturing activity, with the activity index rising to a still contraction level of -1.99, while future activity also increased; rising to a level of 35.43.
The latter is nearing highs not seen in all of 2015 and 2016; another hint that we are slowly but surely burning off the energy negatives.
This is also part of the reason it has felt like that US economy has been walking through quicksand.
One more note: while everyone complains about artificial intelligence, let's just be thankful some robots exist.
If they didn't, who would man the factories now producing near all-time record output?
You can thank Gen Y for the push.
The Results
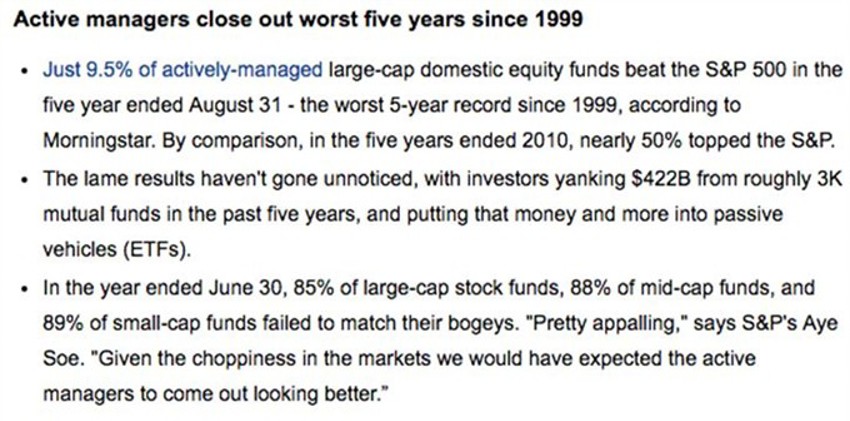
An interesting piece from Morningstar, the creator of those God-awful "style boxes."
They focus on an item on fund managers’ results with data up to the end of August that covers the last 5 years.
It's pretty ugly. Take a look:

Unfortunately, most don’t recognize the culprit lurking in the background of this data.
It's emotion.
The knee-jerk reactions quantify terrible judgment that’s only visible in hindsight.
Fund manager tends to see significant withdrawals as prices wilt. This causes two things: A demand he / she sell when prices are low to meet redemptions and, a lack of capital to buy stocks while they are cheap.
On the flip-side, the fund manager tends to see inflows only after markets have risen. They’re then faced with having to buy the very same stocks at higher prices.
Sounds simplistic, right? But the public tends to see a mirror image of their emotional reaction waves ripple through the "results" published by the fund manager world.
And be careful what you wish for: ETFs are not what most people understand them to be. They are becoming one of the primary causes for the chop we see when the “sell alarms” ring.
Long-term investors cannot possibly believe that the massively increasing wave of double-digit moves in specific stocks, seconds after an earnings note headline is released, is driven by John Doe and his broker, right?
Closing Thoughts
I’ve said this repeatedly: Anytime you think people are too bullish just wait around for a few days of red ink and watch the fear spike and sentiment levels fall-off…again.
Setbacks are your friend if you remain focused on the long-term horizon and what is shaping up here in the US.
And as much as the media coverage only covers the dark views, many parts of our economy have never been better.
Very significant waves of demand are building in our economy that will not be clear to the mainstream until they are patently obvious.
