Too Close to the Flame
Marching through the final month of the year in amongst a ridiculously over-analyzed election result, the mind-bending Trump coverage on the Carrier deal (all bad, of course), internal shifts between market sectors, the slippery slope in the bond market in recent weeks and the latest OPEC "deal"…and I keep getting one simple lesson ringing in my ears: We are way, way too close to the flame.
At times like these there are phases.
First, everyone leaps to conclusions.
Then they take too many actions far too quickly. Think about it; sure technology is great, but just because there’s a sell button doesn’t mean the door out of the barn got any bigger.
The final phase (while all the feathers are floating to the ground) is usually something like this: "Oh, wait; I may have jumped the gun."
My Point?
An awful lot of stocks have moved significantly in recent weeks. Industrials and financials have done two years’ worth of rallying in three weeks, while bond-related dividend paying stocks have been, well, taken out back and shot – twice for good measure.
It's a classic short-term view of normally, very long-term events.
Let me try to explain:
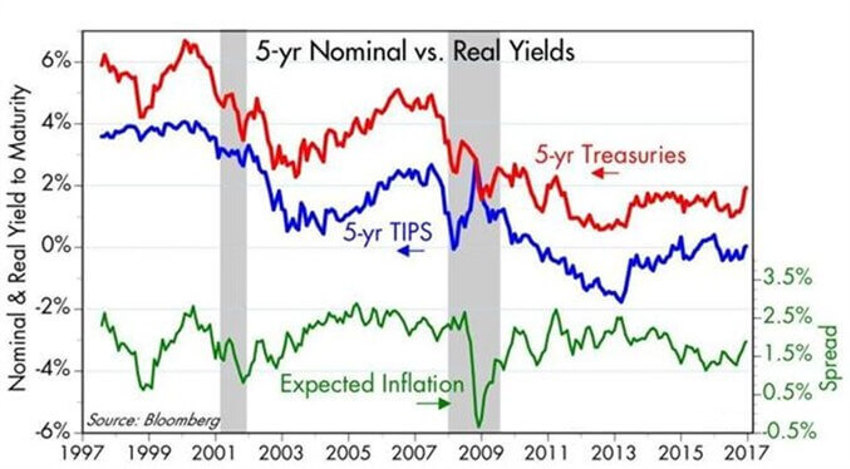
First, rates have moved. It’s not the end of the world and as the chart below shows we lived a vast number of years in history with far higher rates.
In fact, we have merely returned to where we were last year.
And we are many miles away from where we were in 2005, 2006 and 2007 - when everyone thought the future looked wonderful.
How quickly we forget.
One more thing: It is a resounding positive that rates are finally rising.
Why?
Because rates were falling to near lifetime record lows for one primary reason: Deep, stark, raving-mad fear.

Long View
If you consider a longer-term view it may help to note that the yield picture is merely getting us back to where we were at the 2009 and 2003 equity bear market lows!
The fact that fear may finally be ebbing is a great thing.
As we’ve said over and over again for the first 6 months of the year when the world had suddenly been clued into the previous years of deflationary pressures, "Now that the whole world is assured that deflation is our future - let's begin to note in our minds that inflationary pressures will be the next surprise."
Now that the deflation monster may finally be exorcized, why would the masses assume this is a bad thing?
And by the way, let us not forget the great inflation fear rebalancing tool that we have in place for the next 30-40 years: Generation Y.
Yes, it is highly likely that the bond market is finally sniffing out recovery in confidence and some ancillary inflationary pressure drivers.
I think it will be proven a mistake to assume this is a) terrible and b) will only get worse now that the "Genie is out of the bottle," as I am sure we will hear being shouted from the rooftops soon.
It isn't and it won't be.
That’s because Generation Y will sift deeper and deeper into our corporate structure as the days pass ahead.
They are a hugely deflationary force that make things easier by cutting out layers and costs; that’s their game.
In fact, that has been their stall since they opened their first iPhone under the tree on Christmas morning when they were younger.
And soon, no matter what ails you there will be an app for that...
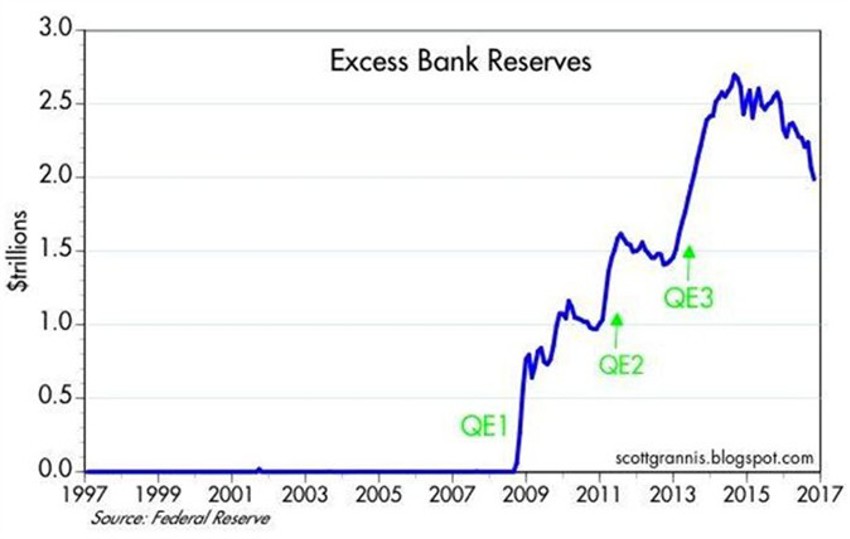
But just one more thing on rates and inflation fears: As I showed you last week the Fed has been operating a very stealthy move in removing reserves (excess cash) as fear slowly recedes.
In time, we will likely find that Bernanke and Yellen stood watch on a compellingly risky time and they handled it very, very well for all of us.
Here’s a reminder on that stealth move on reserve reductions.

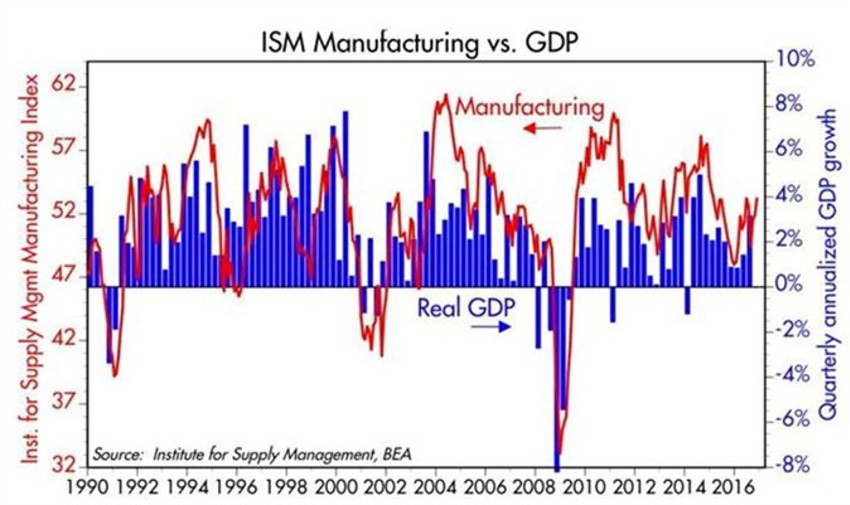
How About US Manufacturing?
As the energy pit is also receding the headwind against output and orders is falling too.
The good news? I suspect by about mid-2017 to maybe Q3, we will find there is a significant pent-up demand for new equipment in the long suffering energy area.
We should have learned the lesson of patience by now: When we see weak spots they are often more like pre-cursors to "Pent-up demand rebounds" coming later.
This time will likely be no different. Indeed, it may already be showing up:

Overvalued Already?
I will argue today that the most frustrating new lesson heading toward us is this:
Few investors remember what the 80s and 90s were like. After all, those good feelings were drowned out and buried deep in the recesses of our minds by the s-called "lost decade" that kicked off this century, and the ugly fiscal policy that followed. Heck we still talk about 2008-2009 like it is with us today; even as it sits 12,000 points lower in the Dow Jones market timeline.
The point is this: We are about to get a whole new series of lessons. For 15 years the term "correction" has been painful, often many months long and lots of red ink. Heck, it was just three weeks ago when the SPY traded at the same price seen back in April of 2015.
Think of an environment where markets just generally go up; many days by a tiny amount, others by almost nothing, and still others by a pretty nice leap for the day. Now imagine all of them kind of blending together - and before you know it, things are 4% higher, then 6% and then 10%.
Corrections?
Well, in secular bulls like we had in the 80s and 90s, corrections were different animals.
It’s my hunch that we are approaching a period where corrections will be very, very short, so much so that they will become the next thing that confuses the investor herd audience.
Confusion will reign as experts tell us things are over-priced.
And I think it will be several years and thousands more Dow Jones points before that $9 Trillion in the bank, sitting idle (out of fear), budges that much.
After all, "It will at least be earning some interest now," eh?
The economy is shifting into a gear we have not seen for an awfully long time.
And better US fiscal policy will help the economic baton shift to Gen Y's economic demand and drive the type of growth numbers that we have long forgotten.
But When?
But there’s still work to do. And that relates to the culprit I mentioned above.
The only risk I see in the near-term is that the speed of change in markets trying to anticipate this may have gotten a bit ahead of itself.
I could easily be proven wrong of course, which would only show that the building strength is even more significant under the surface.
This helps you to understand why I say we should always pray for a correction: The next 10, 15 and 20 years are set to be vastly different from the last 15 years of chop and roller-coaster rides.
The risk? Investors have become so accustomed to the disappointments that they stay back on their heels - afraid of the improvement to come - thereby missing much of the benefit.
Fear is not just an emotion, it’s very expensive too.

As stated in the notes earlier in the week, the tendency is to fear new highs. After all, our mind can only see where we have come from and how far we can fall back. Those are the lessons of the last 15 years.
We cannot see the future and where we can go - like when the Dow was at an all-time high at Dow 3,000, 4,000 or 5,000.
Ask yourself this: What will your perception of risk be when the Dow is 38,000 and you think way back to when the Dow first went over 19,000? To help one not get lost in the big numbers, it is the same percentage shift as when we looked back on Dow 1,000 - when it crossed 2,000....or when we looked back to 3,000 when we hit Dow 6,000.
Larger numbers automatically drive higher fears - which is why we must focus our mind on percentages.
Speaking of Percentages
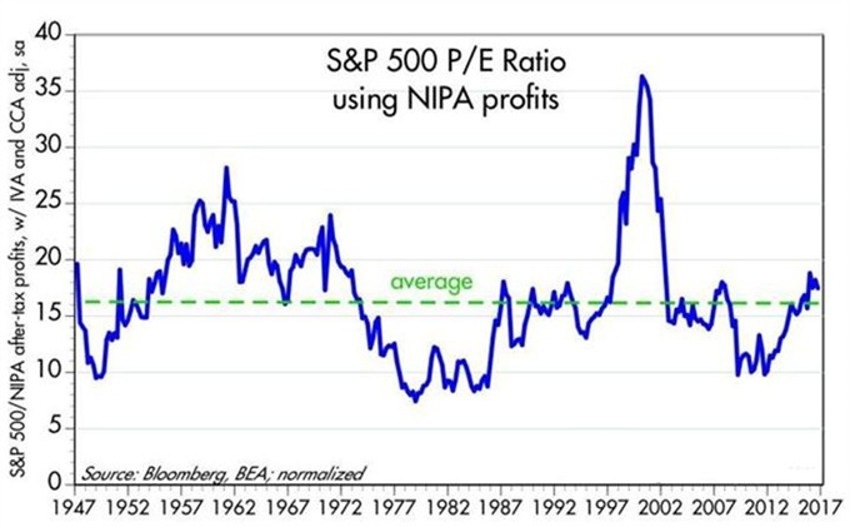
The chart above shows us valuations based on NIPA profits; the truer sense of what business is really earning.
Why NIPA?
NIPA profit readings tend to be superior to FASB profits, as even Art Laffer has argued for decades.
After all, accounting gimmicks are called that for a reason - so we like to focus on what they report on their tax returns instead - which is what the Fed data shows in the last chart above.
Take a look. The chart uses NIPA profits as the “E”, and the S&P 500 index as the “P”. Here you can see that P/E ratios are only slightly above average (17.5 vs. 16.5).
While I stand by the idea we should pray for a correction, at the very least, these charts support the notion that stocks are not egregiously overvalued as too many continue to argue.
In Closing
Speed is everywhere.
But investing is not a speedy process, and neither is building wealth.
Plan first. Then stick to your plan.
