The Bad Times Don’t Come to Stay, They Come to Pass…
I’ve been told since 1982 that I wear rose-coloured glasses.
Maybe so, but the overwhelming signal from history suggests it’s far more valuable to wear those “happy specs” even during the bad periods.
That’s because the bad times don’t come to stay, they come to pass.
And we get stronger for them, though sometimes it’s a painful process.
The Quiet Confessions of an Optimist
Recently, Warren Buffett hinted at the idea that the Dow Jones will likely reach the dizzying heights of 1,000,000 points in another 100 years or so.
My hunch is that Mr Buffett is being way too conservative.
Mario Gabelli has put pencil to spreadsheet burning the midnight oil and found that a one-million Dow Jones in 2117 would amount to a 3.9% compound annual growth rate (CAGR) from now to then.
CAGR Me This…
Now note the actual CAGR since 1917 is closer to 6%!
("You’re nuts, Williams.")
Maybe…But a century ago when America entered World War I against Germany, the Dow industrials declined to 65.95 before closing out the year 1917 at just 74.38.
That was a big rally off those lows. However, the Dow sank even lower (under 42) in 1932, and remained under 100 until early 1942.
Imagine telling someone back then that less than 80 years later the Dow would be over 22,000!
There was no smooth sailing then, and there likely won’t be now either. And the math geeks will tell you that the Dow did dip just under the 4% CAGR hurdle in the 1970s and up through 1982.
Remember that? That was called the last "lost decade."
Enter the Baby Boomers on their life's trek and it was off to the races.
Even through the dark days of 2008-2009, that fall did not take the long-term CAGR below 5%.
With the Dow Jones closing last Friday at 22,773.67 the 100 years just completed saw a 306-fold gain (+30,518%).
A similar gain in the next century would take the Dow to over 6,500,000.
That’s why I’m thinking Mr Buffett’s prediction might well fall a tiny bit short.
Dr Ed Says…
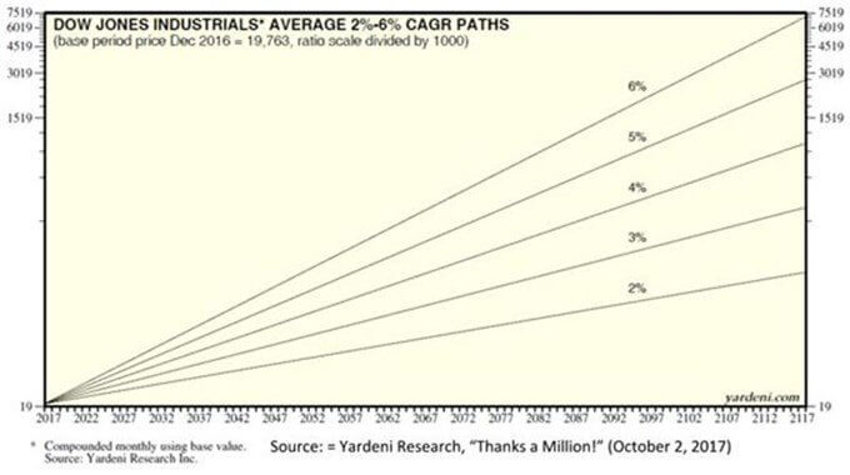
Here is a great chart from Dr Ed Yardeni and his team at Yardeni Research.
It tells us when we take things forward from the last day of 2016, that a 5% CAGR would bring the Dow to 2,729,000 by the end of 2116.
Notch that up just one percentage point more to a 6% CAGR and you get to over 7,000,000:

More Maths - Mind-Boggling
Note these calculations don't account for inflation, but neither do they account for dividends.
History shows us repeatedly that over time re-invested dividends tend to not only compound well but also offset long-term inflation.
In fact, using the S&P 500, Dr Ed tells us that total returns (with reinvested dividends) have risen 9%-11% (CAGR) since 1950, or 6% to 8% after inflation.
And finally, since the lows of the tech bubble bursting (inclusive of a very painful 2008 and early 2009), the Dow and S&P 500 have each more than tripled, and that ugly old NASDAQ is up six-fold as Generation Y just begins to take the reins.
In case you’re wondering those numbers are none too shabby, and even slightly above those long-term averages noted above.
In the grander scheme of things a tripling in 15 long years may not sound great, but fear has kept the masses out of most of it.
So, over time:
- 9-fold in 30 years
- 81-fold in 60 years, and get this,
- 729-fold in 90 years.
The Flip Side?
Now, if we just shift the prism through which we see the world just slightly we might be able to see a perfect example of fretting over nothing.
The US Dollar had been rallying up to the end of 2016.
And expert after expert told anyone who would listen that the Dollar's "strong rally would surely decimate the earnings potential for many companies with global revenues...."
The chatter went on and on, with millions of (virtual) gallons of digital ink wasted on the topic and billions of dollars of expensive "movement" as brokers drove changes through client portfolios and positions due to all that group-think.
Then the Dollar started off 2017 by immediately tanking. And it has continued that trajectory up to and including until about two weeks ago.
So what are those same experts telling us now?
They’re saying that "the dollar's plunge is getting worrisome, soon to ignite troubled inflationary pressures, jacking up rates and bringing the whole world to its far-too-indebted-knees..."
Alas, the dollar has now bounced and, as you might have already figured out, the chatter is brewing that this time, (yes, this time) it really will blow-up the earnings story for our multi-nationals.
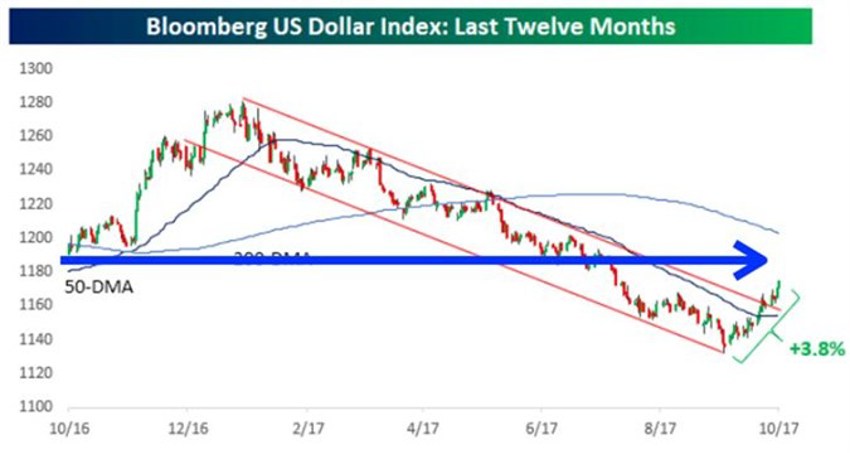
The only important part of all this wasted mess, consternation, chatter and angst is revealed when you look at the chart below of the US Dollar.
I’ve drawn a straight line across the chart to help you see the ONLY important thing to focus on - something that no one will mention because, well, it's not really exciting news.
The US dollar is almost exactly 1% lower than it was last year at this time, even after that ugly old rally of the last few weeks.
Which means all the noise was relatively meaningless, and utterly ridiculous

As Always....
We always get to choose what we are going to listen to and take in as important.
And i's the long-term current we need to invest in, not the short-term waves that roll in, make a lot of noise and then break on shore.
As for my rose-coloured glasses, well they’ve let me see things pretty well for the last 30 plus years.
