Missing Wealth by Planning for a Correction
If you’ve got a long-term view of the markets, and are looking down on them from about 50,000 feet, is the current market activity really that much of a surprise?
It’s certainly confusing the investor herd, the experts, the media and the soothsayers. And too much attention is being focused on President Trump, or at least until a bigger story drags the media off his trail.
Of note, the first 100 days of his term are bumping along pretty much as we suspected they would. That’s a normal ride for a President coming into office, though this one has been pretty exciting.
And for the sake of perspective; a solid corrective wave would be a good thing in the long run, but I have no clue whether we will be lucky enough to get one or not.
Quite a Shift
It was about a year ago when slow growth, deflation, earnings recession and Armageddon chatter ruled the day.
Fear was everywhere.
Sadly though, while thousands of Dow Jones points have been gained since then the fear has remained as it was. And the “Apocalypse Now becomes Apocalypse Later” process remains solidly in place.
That’s good news for long-term investors. It means the next correction will likely shake the loose hands from the stock market tree and create value opportunities.
Let's Review
The Barbell Economy Effect is still in play – as the Baby Boomers continue to hand over the economic baton to the Millennials of Generation Y - and in our view it will only accelerate over the next few decades.

Now, let’s forget about that "Dow Jones over 20,000" number for a moment.
That’s because the larger this number gets, the more paralyzed the investor herd becomes – and the more it rises, the more alleged problems arise. It’s a bit like the dizziness you feel climbing up a mountain; the higher we get, the more our fear rises.
And we feel that way because we become more and more aware of how far it is that we can now fall.
Look, there will be a correction. It will be ugly. But we would have argued the very same thing in late 1982, when we first broke above 1,070 in the Dow Jones. Back then the experts were sure the risk of correction had risen, and that the pain was near.
It's just like they’re thinking it today.
Of course, the correction did come, but only after the market doubled almost 5 years later, on October 19, 1987.
That fact reminds me of how more wealth creation is missed by planning for the next correction than is ever "lost" in an actual correction.
The Bigger Picture
It’s vital we recognize the larger event driving this.
As much as the pro-business environment finally emanating from Washington DC is a very big positive, this is all being thrust forward by the demographic shift underway; and a massive misunderstanding of same.
The baton of power is passing.
But the problem is that the demographic issues move so slowly as not to be readily apparent - unless you’re looking at the proper road signs along the way, you can easily get lost in the noise.
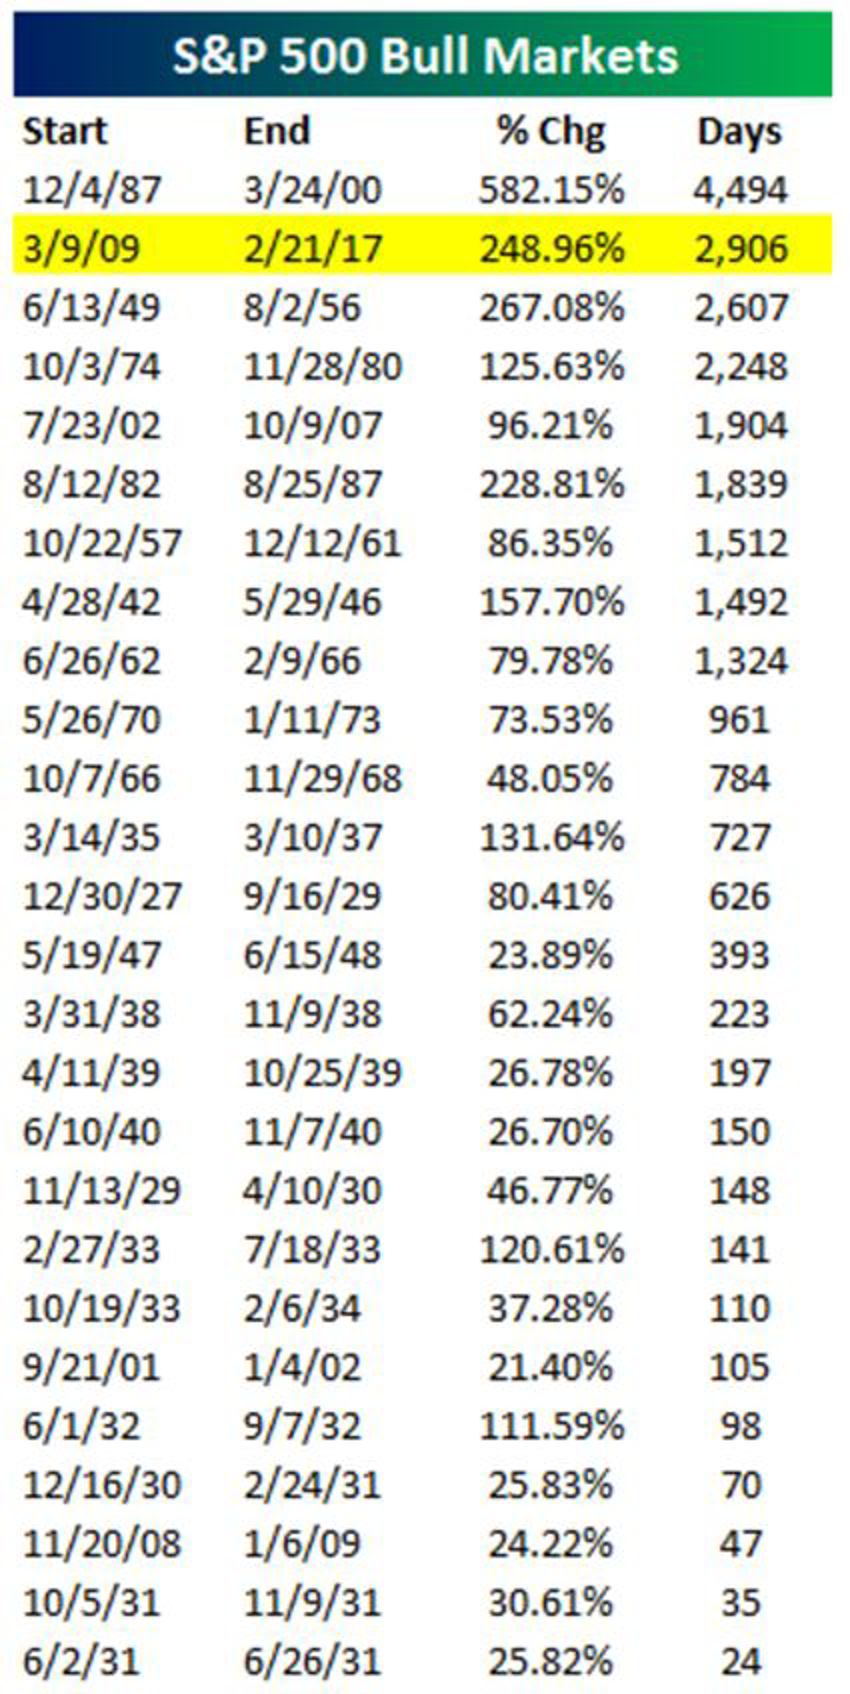
By the way, in case you need anything else to worry about the snapshot below tells us that in a mere 1500 or so more trade days, the current bull market will be called the longest on record:

Old Bull or Young Bull?
Keep in mind that I disagree with the age of this secular bull.
My view is that the first five years of this trend was simply a recovery to the point of pervious highs.
The new secular bull would then only be defined by the beginning of the new all-time highs.
From that perspective - and only time will tell - this is still a young bull that’s set to still surprise a lot of people out there.
Let's Be Clear
Look, there is never a period when everything is perfect; like now.
And as much as we remain confident of the long-term drivers of economic growth ahead for the US, there are elements that will always unfold in the short-term to cause a storm.
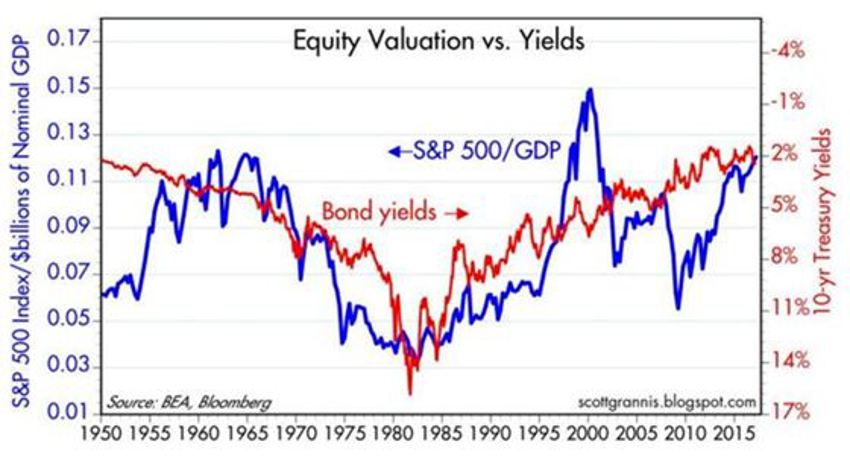
Mr Buffett has a special indicator he likes to watch. The chart below from Scott Grannis gives us a snapshot of it.
Warren says that the ratio of stock prices to nominal GDP is his preferred measure of stock market valuation.
Stock prices, in theory, are the discounted present value of future profits. So it is not unusual to see, as the chart highlights that equity valuations tend to increase as interest rates decline, and they tend to fall as interest rates rise.
Valuations and yields are roughly the same today as they were in the late 1950s and early 1960s, and neither valuations nor yields appear greatly distorted relative to their historical relationships.
Let's also note that stocks are certainly not cheap at current levels, but neither are they exceptionally overvalued.
So what we should be aware of is the need for the U.S. economy and corporate profits to resume their healthier long-term rise, or the markets will likely have a trouble spot to deal with at some point.
And don’t be shocked with higher rates as they hint that inflation has arrived back on the scene. Near-term bouts of choppiness in stocks are likely long-term opportunities around those rate hikes.


The New Problem?
This may not be a full-blown problem per se, but it is something to be stay aware of over time.
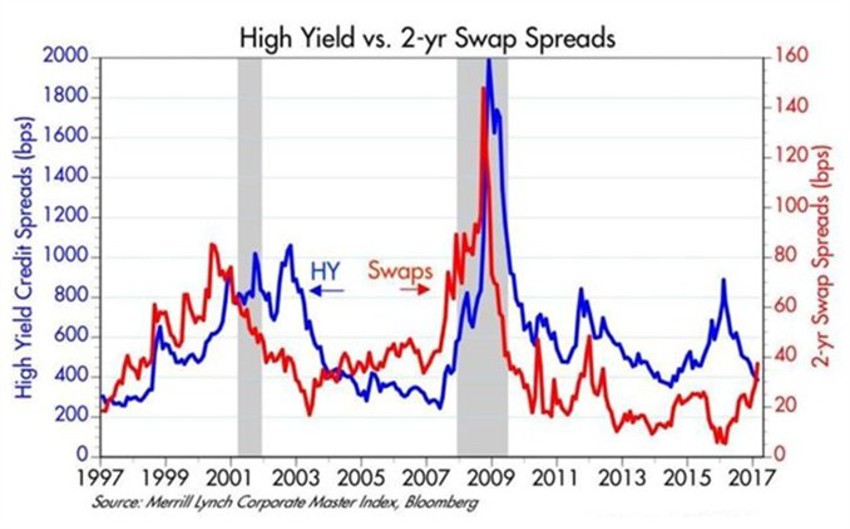
We have highlighted that swap spreads can play a role in signalling the health and future growth prospects of financial markets and economies.
As the chart above highlights, swap spreads tend to rise in advance of recessions and then decline in advance of recoveries.
Swap spreads are far more liquid than high-yield credit spreads, so they tend to react quicker to changing fundamentals.
That swap spreads have been rising of late while high yield spreads have been falling is thus something worth watching.
So what’s going on?
Well, maybe nothing.
Swap spreads are still relatively low, so they’re not necessarily forecasting a severe deterioration in our economic fundamentals.
However, their predictive history demands a healthy respect for the noise. Something is going on out there that is worrisome, so some degree of caution remains warranted.
(It could be perceived political risk that eventually burns off, and that would help explain why 5-year Treasury yields are as low as they still are.)
Think Demographics, Not Economics
We are in much better shape than many realise.
The good news is that if you scratch the surface just a tiny bit, you will find the investor herd is still petrified of risk.
And if you need proof of that then just watch what happens after a two week stock correction – it will quickly reveal a crowd that is as afraid as they were back in March of 2009.
