Meanwhile, The Markets Went Up
“If you aren’t thinking about owning a stock for 10 years, don’t even think about owning it for 10 minutes.”
– Warren Buffett
Bad news, eh? The garbage on the airwaves has been like a choking smog; terrible Trump, sexual harassment, the nutter in North Korea, US tax-bill mania, Federal Reserve interest rate rumours, a few Category-5 hurricanes, California wildfires and, of course, the so-called experts out there trying to tell us what it all means.
Meanwhile, the markets went up.
The media talking heads railed. The bankers bitched. The strategists divined. Investors remained perplexed.
Meanwhile, the markets went up.

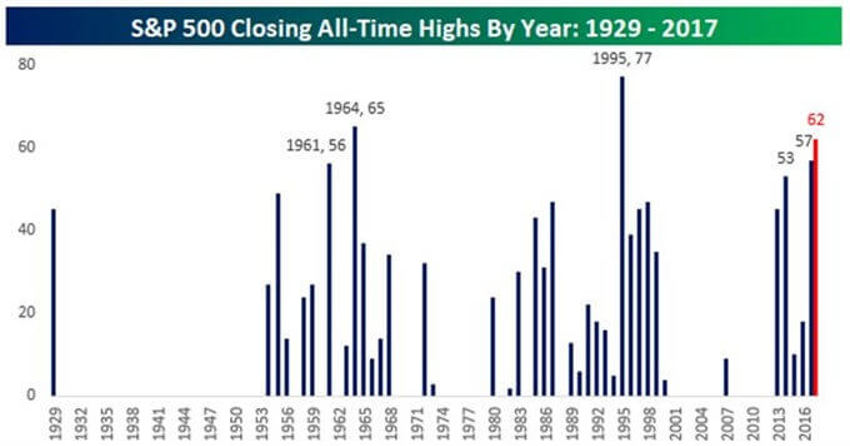
Lots of record high closes, right?
To be fair, this chart is a bit misleading. When the markets start on a high, going up just one point higher is going to be another record. As such, a market trending to the upside could set a hundred records in a year with little problem.
My hunch is that we’re looking at one of those types of years ahead.
Here’s how things look so far:

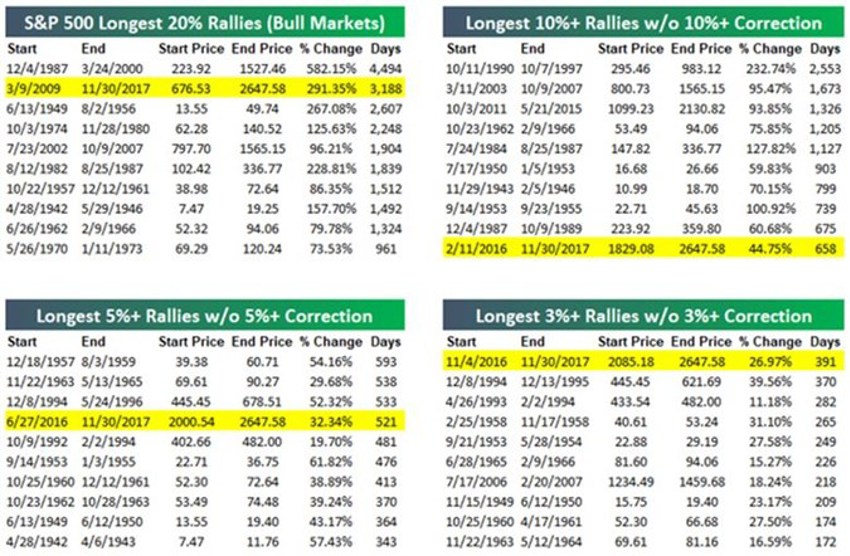
The magnitude of gains this year has been a long way from record breaking for a typical calendar year, but the consistency of those gains has been without precedent.
The tables above show how strong and steady the market has been, as the S&P 500 is in its second-longest bull market (if you see the bull as having begun in March 2009. I appreciate some do not). That’s the tenth-longest streak without a 10% correction, the fourth-longest run without a 5% decline, and the longest rally ever without even a 3% decline.
Be both factual and practical, at some point the bough will break and we’ll have a very tough period. It will be ugly for a bit. This has always been the cycle of things, and so we can expect the future will likely follow the same historical pattern.
Market history has also taught us that trying to bet on when that turn will happen has been a very expensive effort.
What we suggest instead is to focus on the long-term forces of the Barbell Economy and Demogronomics.
That demands patience and discipline.
Over $10 trillion still sits idle in US banks (multi-trillions of pounds and euros are doing the same in the UK and Europe, by the way), earning little and remaining unproductive. Yet, bond fund offerings are sold in minutes, with waiting lines and competing bids aplenty keeping interest rates low the world over, even as earnings and equity records continue to be set.
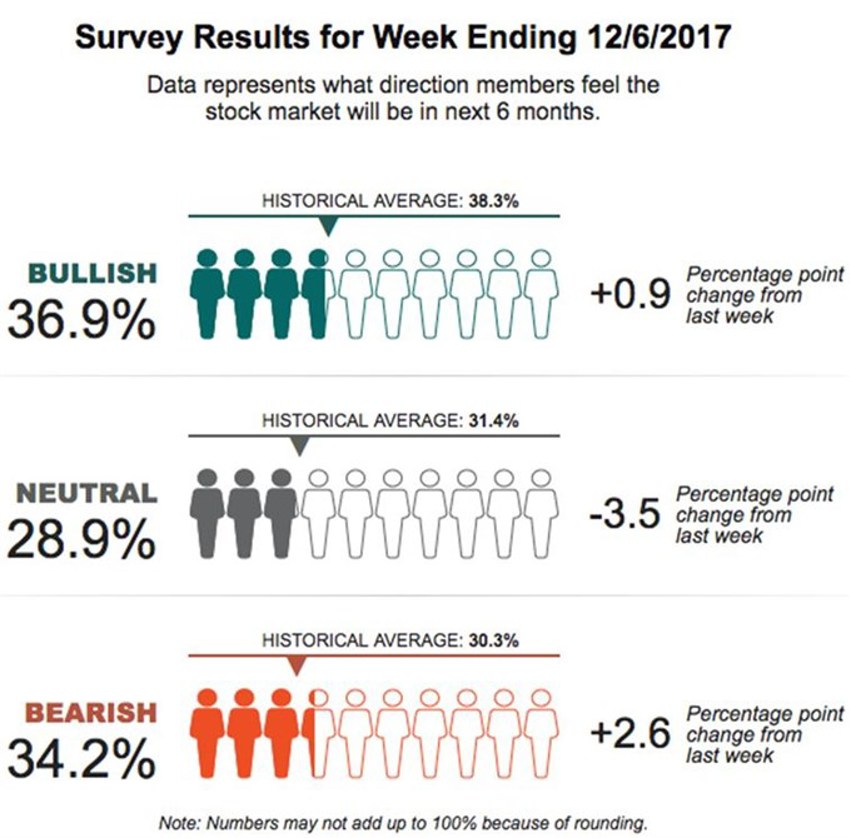
Here’s the latest on that:

Once again, what’s fascinating here is the movement from one sentiment spot to the next.
While bullish sentiment levels remain extraordinarily mundane for what are record-setting markets (almost 65% are not yet bullish), note that for every person that left the neutral camp and moved to the bullish camp this week, 3 went to the bearish camp.
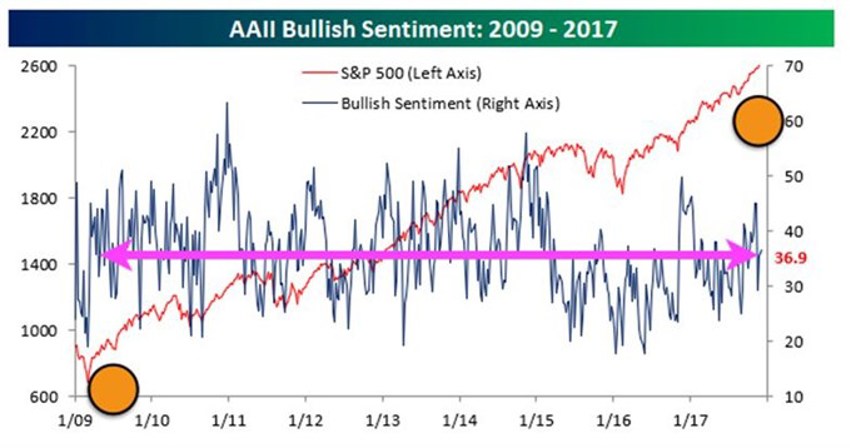
Seen another way:

The chart above is the same sentiment data with eight years of the weekly reports all connected; the blue line is market sentiment, and the red line is the S&P 500 overlaid on the same timeline.
The two orange circles and the pink line have been added to provide you a point of view.
The crowd feels today pretty much the same way it felt midway through 2009. Now have another look at where the red line (the S&P 500) was back then, when sentiment was at the very same level it is now.
Heck, even all the bullish reading spikes in the AAII data (blue line) all mark times where the stock averages were lower than where they are now.
Remember folks, patience and discipline in this game wins out.
And worrying about the next setback may sell a lot of ads for the newspapers but it won’t make you any money.
