Just What The Market Doctor Ordered...
Have we passed through all the chatter about FAANG, tech, etc.?
How about the death of the markets as we know it?
Nope.
The corrective action is what we need to learn to endure on the way to our financial goals.
And this summer is set to be no different.
So, as a reminder, I thought we’d take a quick look at the times between "corrective market waves", which again, are perfectly normal.
In fact they’re a requirement of all secular bulls:

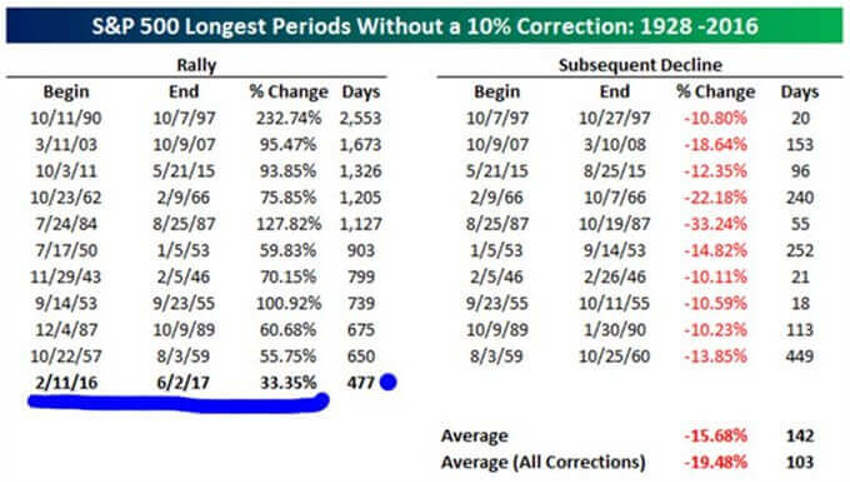
The table above shows a list of the ten longest market rallies without a correction.
In the right side of the chart you can see how much the S&P 500 declined in the ensuing correction – a point which is currently all the rage.
But keep this in mind: For the current rally to crack the top ten in length before a correction unfolds, there is a lot more work to do.
At just 477 days old, the S&P 500 would need to go another 173 days before reaching a short-term peak.
That would take the current run past End November (Thanksgiving in America) for anyone keeping notes.
Now, let's be clear that I have no clue if that is going to unfold or not, or if we’ll get a summer market swoon first, but I certainly hope so.
Also, the ten prior rallies not only lasted much longer than the current run we’re in but they were also considerably stronger, as the data suggests.
And for all you engineers out there, the data shows the average and median gains (during the ten prior rallies) that went longer without a correction was more than 90%.
Now, I know what everyone is afraid of the media’s constant reminders of the omnipresent and much feared ugly correction.
And the press hype always suggests that the higher and longer they run the more perilous the fall, right?
But fear not folks.
The data is showing us a very different scenario.
And a bit more…
The data in the bottom right hand section of the table above shows that the average historical decline in the correction that followed the ten prior rallies was 15.7% over 142 days.
But, when compared to all corrections since 1928, where the average decline was 19.5%, these corrections may have lasted longer but their intensity was not as strong.
So, let’s all wonder aloud how close the next big one is…?
The records show that since 1928, there have been 95 corrections of 10 (plus) or more for the S&P 500.
While corrections tend to come at irregular intervals, that works out to about one every eleven months.
That’s important to know. But equally so is that corrections don’t tend to unfold when everyone is ready and waiting for them. And that’s where we are not. All eyes are on "the big one", with trillions in the bank and even more hidden away in "safe bonds."
The Bottom Line
In other words, the tech volatility and negative market sentiment is perfect.
In fact, it’s just what the doctor ordered.
