Investors: It’s Just a Question of Time
There’s a change afoot.
We’re replicating the 1980s and 1990s in terms of what looks set to unfold in the American economy for the next 20 years.
It’s a massive tectonic shift - bringing along with it waves of change; the likes of which a great many folks are completely unprepared for.
Ch-Ch-Ch-Ch-Changes
Contrary to popular belief, change is not always a bad thing.
Scary at times? Sure. Painful? Sometimes. But for the sake of what’s unfolding in our economy they tend to be positive over time.
The problem?
That one word: Time.
It’s probably the most painful element investors must learn to withstand in building wealth; to let things unfold, and to allow time the time it needs to make the compounding effect benefit you.
In doing so all those things that seem terrible at first, and drive so many poor reactions will pass into the dust of history.
And that’s why the markets are fooling the masses again.
Sentimental Fools
How do we know they’re being fooled?
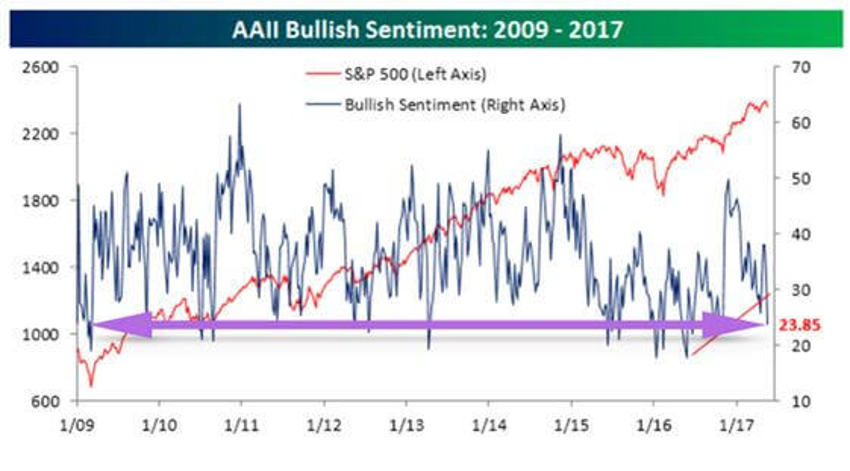
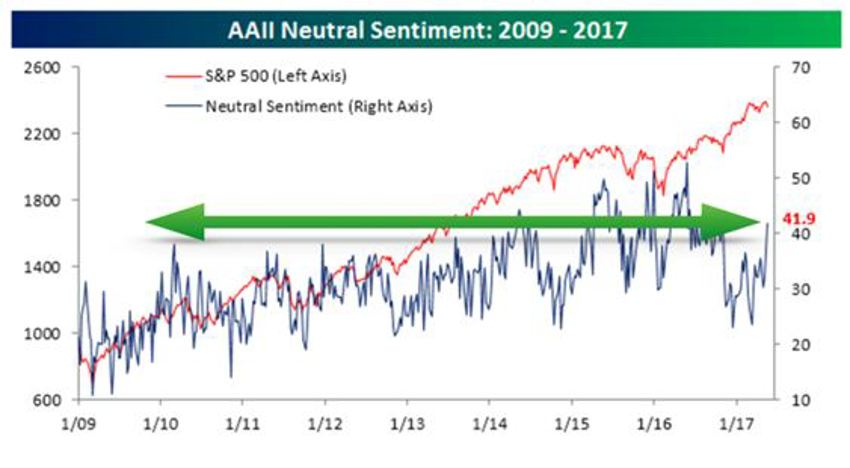
Checks the sentiment stats below. I know I reported them late last week they’re set to change again shortly, but sometimes an image is the most vital way of driving a point home:


The first chart above is for bullish sentiment readings. The second is for neutral sentiment readings.
History shows the latter only falls after prices rise.
Now keep that point in mind as we go.
The top chart showing bullish sentiment reveals the largest one-week decline since July 2015, back in the "terrible" summer swoon – and a dandy of an opportunity to add value.
The red line moving up across the chart is the S&P 500 overlay, while the blue lines are all the connected readings each week over time.
I’ve added the purple arrow to allow your mind to focus on where we are now versus all those other readings over the last eight (plus) years since the beginning of 2009.
And the all important takeaway?
Note how few blue connected dots there are below the purple arrow.
It suggests to you that at very few times - including the March 2009 lows of the Great Recession - has the investor audience been this afraid.
The second takeaway?
Find me a time on that chart where a low bullish reading was bad for the stock market.
The Second Chart - Neutral Sentiment
At 41.9%, it's the highest weekly reading since the election.
Investors were happy to sit on their hands in the months leading up to Trump’s victory, but now it seems they are stepping to the sidelines to wait out what becomes of the Russia investigations - another attempt in the media to side track what the economy is telling us is really going on.
Last but not least; bearish sentiment this week was 34.25%.
In other words, not only is more than a third of the investor audience feeling bearish, but as a percentage of the whole, there are 1.5 bears for every bull - with the neutral camp finishing off the rest.
But Why?
If we focus too much on the headlines, your blinders are on.
They keep you from seeing the full view on the horizon:
The whole world is growing and most global stock markets reflect that renewed growth.
With the dollar now pulling back from the run it had (squeezing our global competitive earnings), we can expect America’s footprint will see a decrease to the bottom line in coming quarters.
And as the world leaves the fog of the last decade behind, it will do so in fits and starts - but doubting that’s happening is a serious error in judgement over time.
Remember that faith and fear ask the same thing of us all: To believe something we do not yet see.
