Investors: A Tale of ‘Too Many’?
Here we are on the doorstep of change once again.
It’s always a little scary for some, exhilarating for others and a complete yawn for still more of you out there.
So, I’ll reiterate the thing that makes far too many far too uncomfortable; the same element we noted back in late 2013, and highlighted again last summer (2016):
“The REAL surprise brewing in markets is that of significant upside for no logical, readable or traceable reason that mainstream media will be able to conjure up. It is the way paradigm shifts unfold. While many often say they will, ‘buy the next dip’ this rarely unfolds; once something ‘dips’ we can rest assured that fear will return. Our days of being able to rely on some big correction to take advantage of may be receding.”
In short, we are paying too much attention to the headline guys.
And that could be part of the hindsight review when too many in future wonder why they were surprised by the upside that reveals itself in the US economy.
A Step Back in Time
I cannot tell you how incredible it has been to have witnessed markets moving from where they were in 1982, back when I started in this business, to where they are now.
Too many may not realize that something we spoke about last summer here completed its pattern as the year ended.
(Remember when 2016 started ugly as the worst start in over 80 years? Then it proceeded to set two records in one quarter – and the best intra-quarter recovery in 83 years.)
The pattern I’m speaking about is called an “Outside Year.” And it is very, very rare. In fact, only two others besides the one 2016 have unfolded.
Yahoo Finance defines it as follows:
"In the last 81 years, there have been only two "outside years" before 2016: 1935 and 1982. Both of these years were followed by the S&P enjoying double-digit gains - +28% in 1936, and +17% in 1983 - which potentially sets the table for a monster rally into 2017."
This comment is not designed to be an assurance; it merely reminds us that odd things happen when too many people don't expect it.
What we as long-term investors must continually protect ourselves against is focusing only on the bad stuff, because it's a poor route to meeting goals, and a sure trigger for making emotional errors along the way.
You’ve Seen All of This Before....
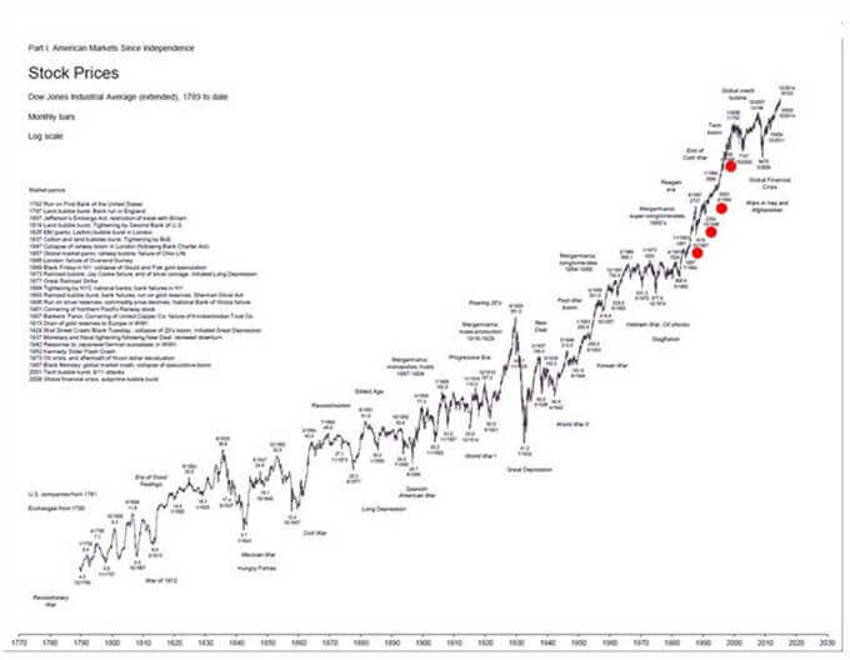
I have included this chart (below) on several occasions.
The LONG consolidation periods - far more often than not - are foundations being built for major breakouts to the upside.
And the longer the consolidation period the better.

This chart above covers the last 220 (plus) years of the Dow Jones.
Even as everything we are petrified of and all the disasters the history books are filled with have unfolded, we are now at the upper right hand corner of the chart.
And those four red dots mark four memorable events:
- First from left to right: The October 1987 crash.
- Next: The early 1990s Recession - we lost 1500+ banks and S&Ls in 2 years.
- Next: The mid-1990s double dip recession fears that never arrived after a 2-year trade range.
- Last: The 1998 Russian and Asian currency crisis.
So how do you think an investor would see those periods today?

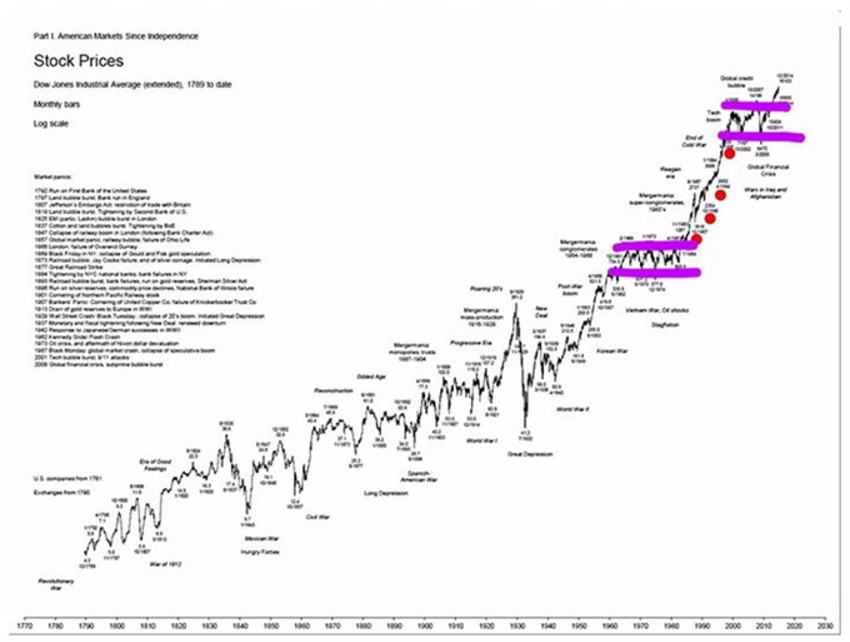
It’s the same chart but with two added sets of purple lines.
They mark the significant consolidation points that took place seem even more significant as generational and demographic shifts.
Now, are you getting a sense of deja vu? You should do!
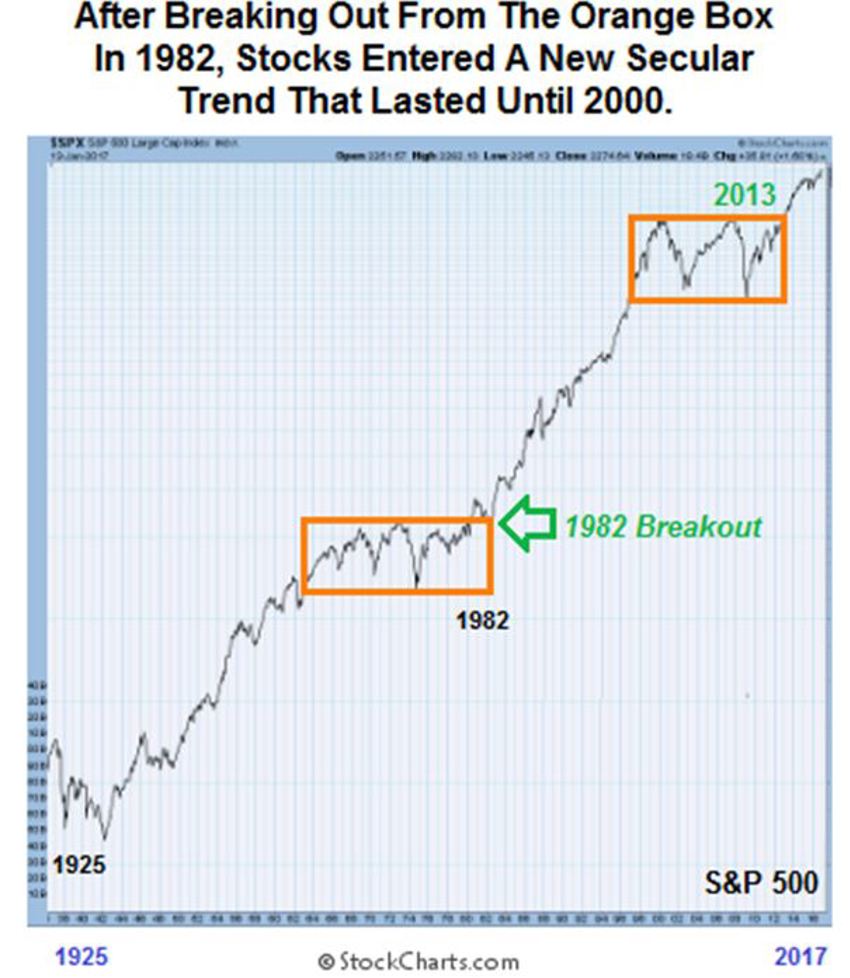
The chart below shows that perspective from a bit closer up.
History suggests the lengthier the period of digestion, consolidation, pause and rest, the larger and more significant the breakouts thereafter tend to be.

One Last Chart for Now
Now let's look at an even bigger picture of consolidation.
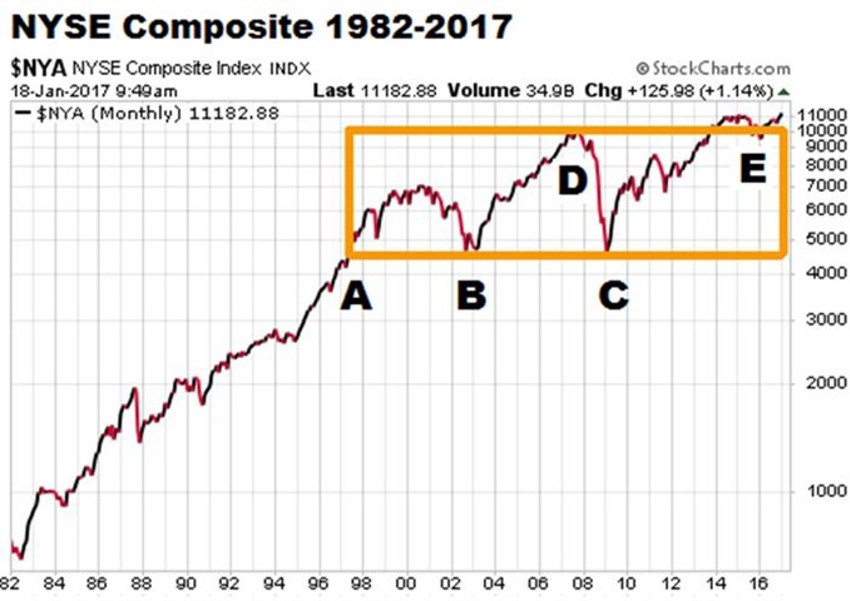
The broad market composite (below) has been shifting and pausing for some time now:

Similar to the multiple-year consolidation before the 1982 breakout in stocks, our present market structure is also sitting just above a consolidation range that started all the way back in 1997.
The good news? The NYSE Composite Stock Index is standing above the orange highlighted area in the last chart.
What’s Next?
Obviously, no one knows where these little lines go from here; just as we did not know in 1982 or in any other previous major breakout.
And therein lies the ultimate problem.
Unfortunately, too many people believe this will become a downward moving journey.
Look, markets and numbers play tricks on an audience. Each time we hit a new high on the climb up the never-ending mountain we don’t ever know what’s next.
All we do know is how far back to zero it is, right?
Hence, the higher markets rise, the higher fears rise when setbacks unfold.
Here’s the Deal
It's a new day. It is a platform of change. Sure, there’s risk. There always has been and there always will be.
So we can assume that we’re stepping out onto a ledge with nothing but risk in our next step
or...
We can move forward like we’re taking the first step into a new garden, filled with lush opportunity on a long and winding road of change ahead.
The choice is yours. But take with you the following lines from one of my favourite songs and artists:
"Same old fears and same old crimes.
We haven't changed since ancient times."
- Iron Hand, Mark Knopfler
Until we see you again, may your journey be grand and your legacy significant.
