Following the Earning’s Season’s Bouncing Balls
Watch out!
October is almost here.
And Christmas is only 90 days away.
It’s stunning how fast 2017 has flown by.
So, with Q3 right around the corner, let's get a quick summary of the latest stats.
(By the way, they’re good.)
FactSet tells us that:
- Earnings Growth: For Q3 2017, the estimated earnings growth rate for the S&P 500 is 4.2%. Eight sectors are expected to report earnings growth for the quarter, led by the Energy sector.
- Earnings Revisions: On June 30, the estimated earnings growth rate for Q3 2017, was 7.5%. Ten sectors have lower growth rates today (compared to June 30) due to downward revisions to earnings estimates, led by the Energy sector. That’s pretty normal.
- Earnings Guidance: For Q3 2017, 75 S&P 500 companies have issued negative EPS guidance and 43 S&P 500 companies have issued positive EPS guidance.
- Valuation: The forward 12-month P/E ratio for the S&P 500 is 17.7.
- Earnings Scorecard: For Q3 2017 (with 6 companies in the S&P 500 reporting actual results for the quarter), four companies have reported positive EPS surprises and four companies have reported positive sales surprises.
Here’s the most interest part of the latest data from FactSet:
"A record number of S&P 500 companies have issued positive revenue guidance for Q3," but it’s still early.
Now, remember that we should expect negative EPS guidance as well given the storms, so when a big deal is made of these things try hard to look beyond their near-term impact.
Thus far by sector, companies in the Information Technology, Health Care, and Consumer Discretionary sectors account for 39 of the 43 companies that have issued positive EPS guidance for the third quarter.
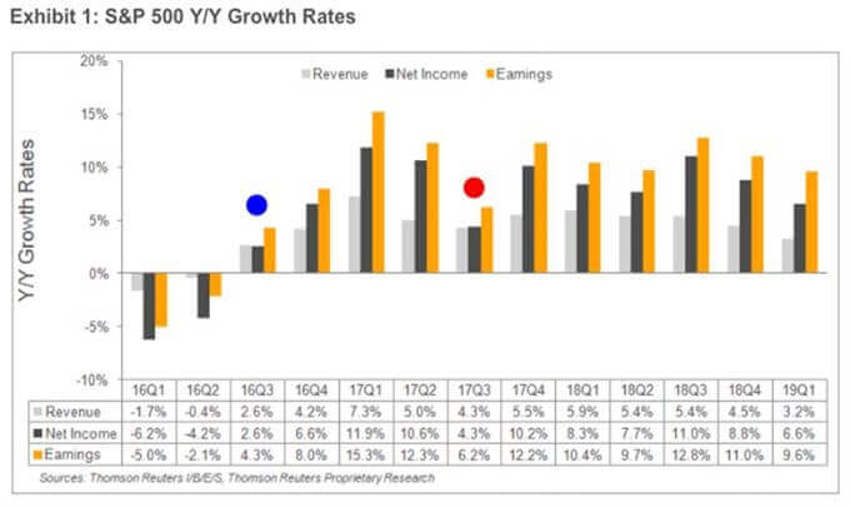
From Thomson data below we can also see that projections moving forward continue to be steady into 2018/2019.
Have a look at the red mark on the low point for Q3 of 2017.
I call it the low point as this will be a major focal point to suggest a "falling rate of growth."
And we touched on this back in the Q2 reporting season.
The growth rate appears slower because last year at this time (marked in blue), Q3 of 2016 marked a return to earnings growth after the collapse in the energy sector that masked growth for the entire rest of the economy.
Folks, this is a numbers game. So don't get sucked in. Rates of growth return to nice levels after the red dot (below), meaning 90 days from now.
And this covers no tax law changes.
If we can actually get Washington DC to finally accomplish something, look for every 1% reduction in the corporate tax rate to mean somewhere between $1.80 and $1.95 more dropping to the bottom line of annual S&P 500 earnings.

