Blinded By the Light?
Webster’s Dictionary defines the word “Doldrums” as: A spell of listlessness or despondency; a part of the ocean near the equator abounding in calms, squalls, and light shifting winds, and; a state or period of inactivity, stagnation, or slump.
I’ve lived all of those definitions, the ocean to the markets.
And this time of year is always fraught with angst and implied peril.
The so-called experts, media celebrities, garden variety talking heads on TV and any number of website headlines are telling us to be afraid of the markets.
The fear trades are getting all the press, and the wilting stock market (about 2.7% off most recent record highs) is the constant whipping boy.
Meanwhile, volumes are nearly non-existent despite all the headlines suggesting violent reactions.
As such, double-digit down moves in stocks have been the norm for the last few weeks.
And if you think humans are the cause of these millisecond reactions while no one is around then I have a bridge to sell you.
Even eclipses are getting in on the act.
The headlines read, "The Things That Can Go Bad for Solar During the Eclipse."
Sheer lunacy, but this time hidden from the masses by the major indices hiding the nonsense under the surface.
The Contrast?
First, here’s a snapshot of insider buying through this past weekend (taken from Barron's) and last week's latest AAII sentiment data.
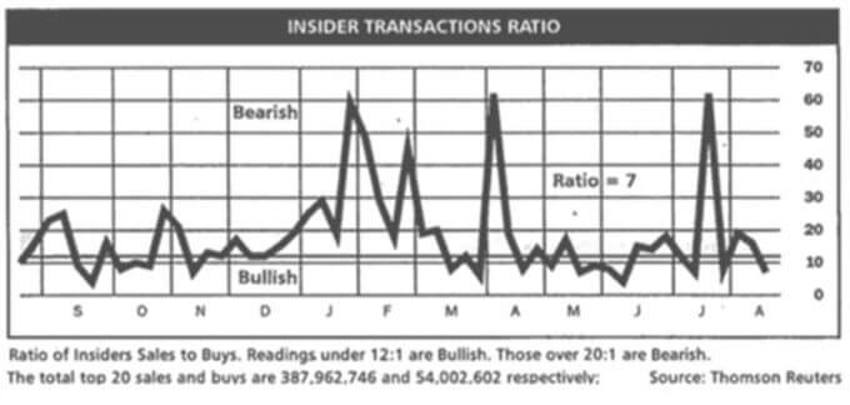
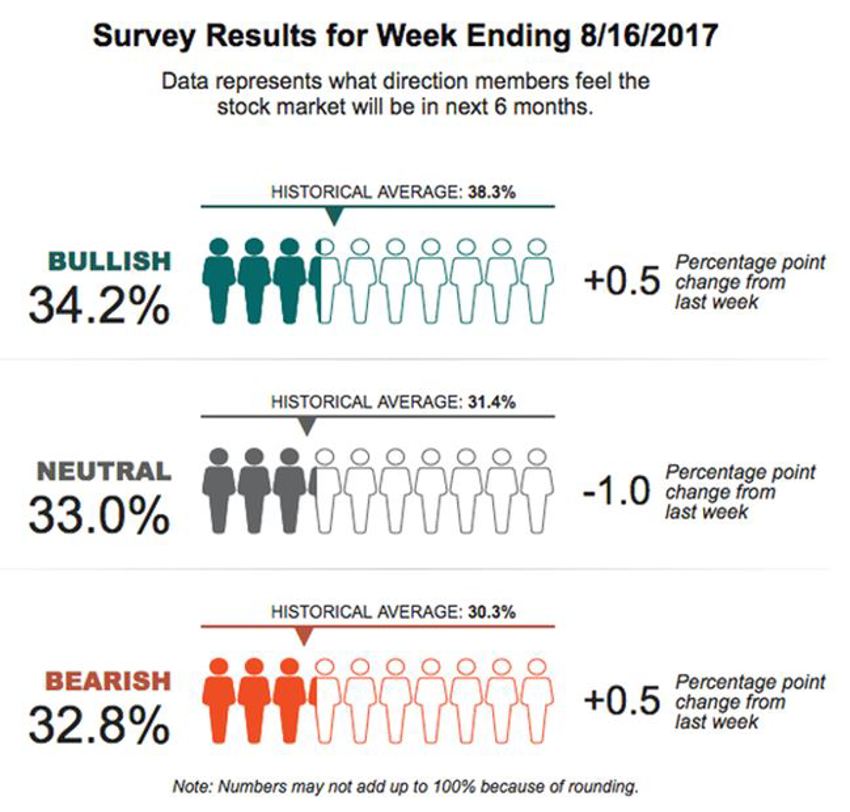
For the insiders in the top chart, a “12” reading is seen as bullish.
The current reading is “7.”
On the other hand, we have spent years talking about how this time around the public crowd is simply not willing to get overzealous or excited about the market.
But they sure do react when it goes down. It’s pretty evenly split in the latest data, with 65% of the crowd still not all that enamoured with stocks at all.
That now a 140-week record-setter with nearly three years of reports showing no majority taken by bullish sentiment.
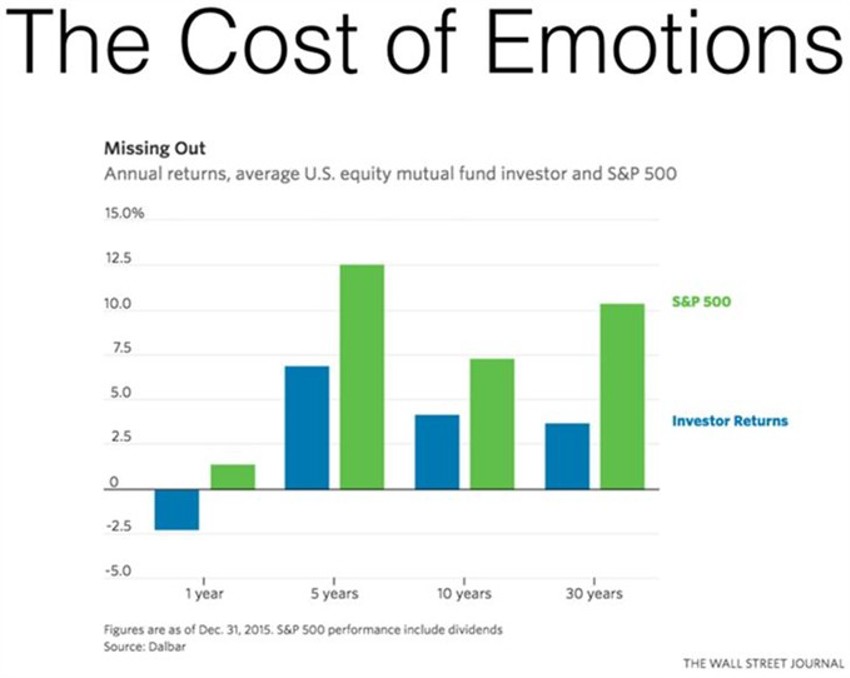
Talk about the cost of emotions.
The chart below from Dalbar that appeared in the WSJ a couple of months ago is a reminder:
To cap off the truly mind-numbing process of contrasts in the market as we trudge through the final weeks of the summer doldrums, note the latest Fear & Greed readings from CNN Money:
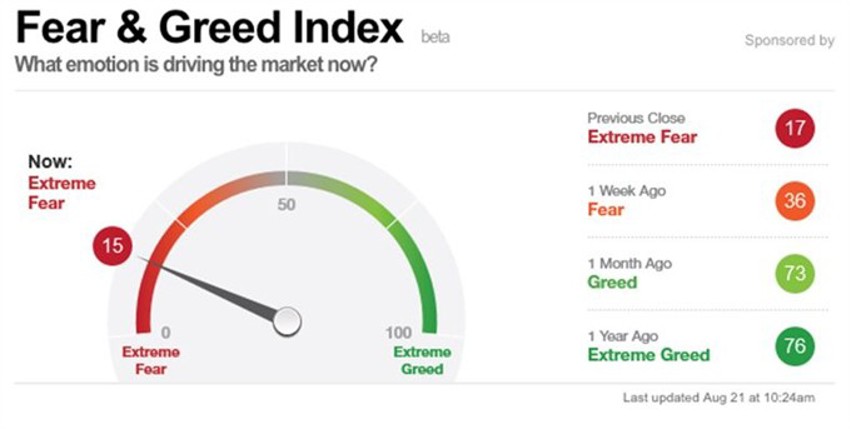
The snapshot above is the latest reading.
And this next chart shows you the last few years of this reading:
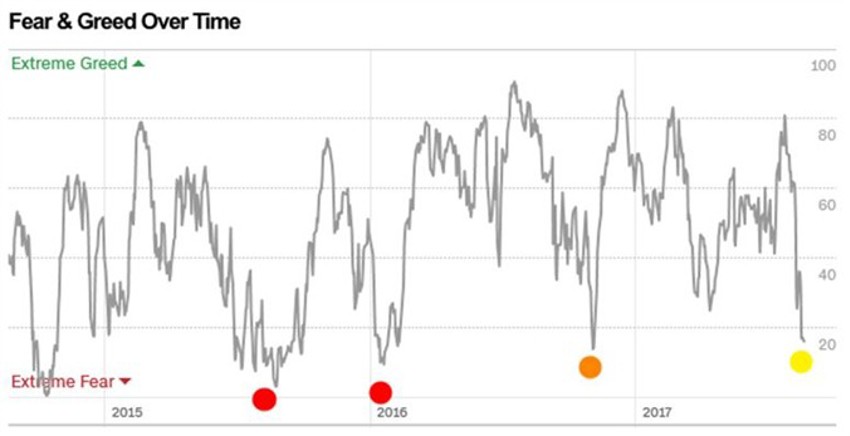
The two red dots mark the Brexit fears and the "worst start to the market in the last 85 years" during the start of 2016.
The orange dot is the election from last year.
The yellow dot is now.
What does it tell you?
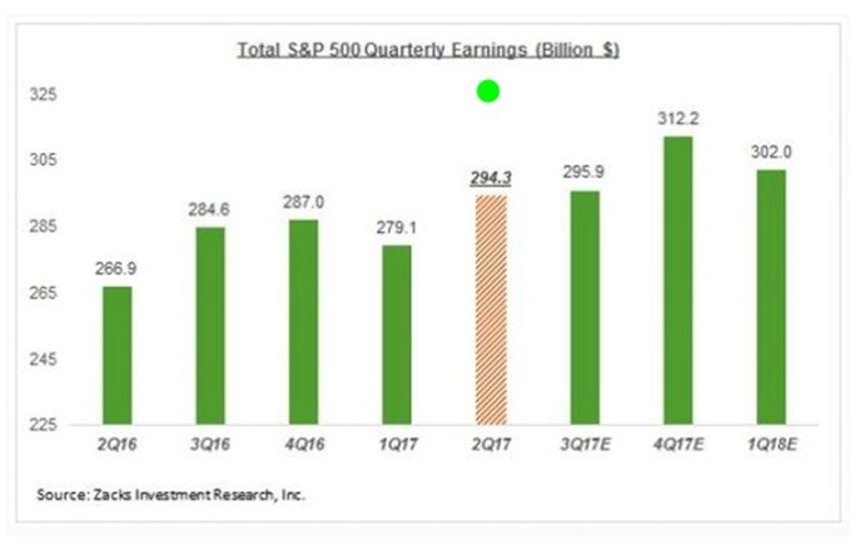
Well, remind yourself that we just set a new all-time record high in earnings.
And the current forward earnings data from Thomson Reuters confirms suggests that we’re several quarters ahead of new quarterly records (the green dot below shows the current record for Q217):
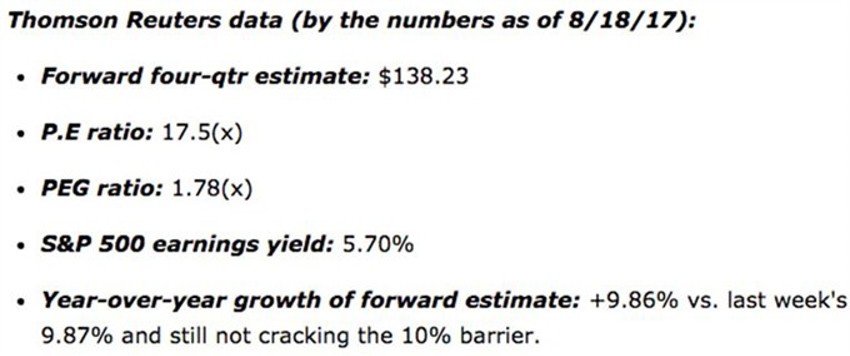
Note the latest Thomson's data above show the S&P 500 is priced at 17.5 times the current four-quarter estimate of earnings.
The Good News?
You can stand in line and buy the 10-year Treasury for the sum of 45.8 times earnings – guaranteed NOT to increase for the next decade.
Not too shabby, right?
Look, the media will continue to only tell you about the bad stuff because saying everything is fine is not an attention-getter.
Record Earnings
Sentiment stinks for investors unless you’re an insider.
Internal churn has been breaking down for many weeks now with a few large cap stocks hiding that in the major indices.
All in all it’s been a pretty normal summer so far.
And while the talking heads will tell you that solar stocks are in trouble because the sun will be hidden from view for 3 minutes, remember that headline spin will reach whatever level it takes you to keep you reacting and clicking.
Pure nonsense.
Focus on demographics and not economics.
